Fig. 24.
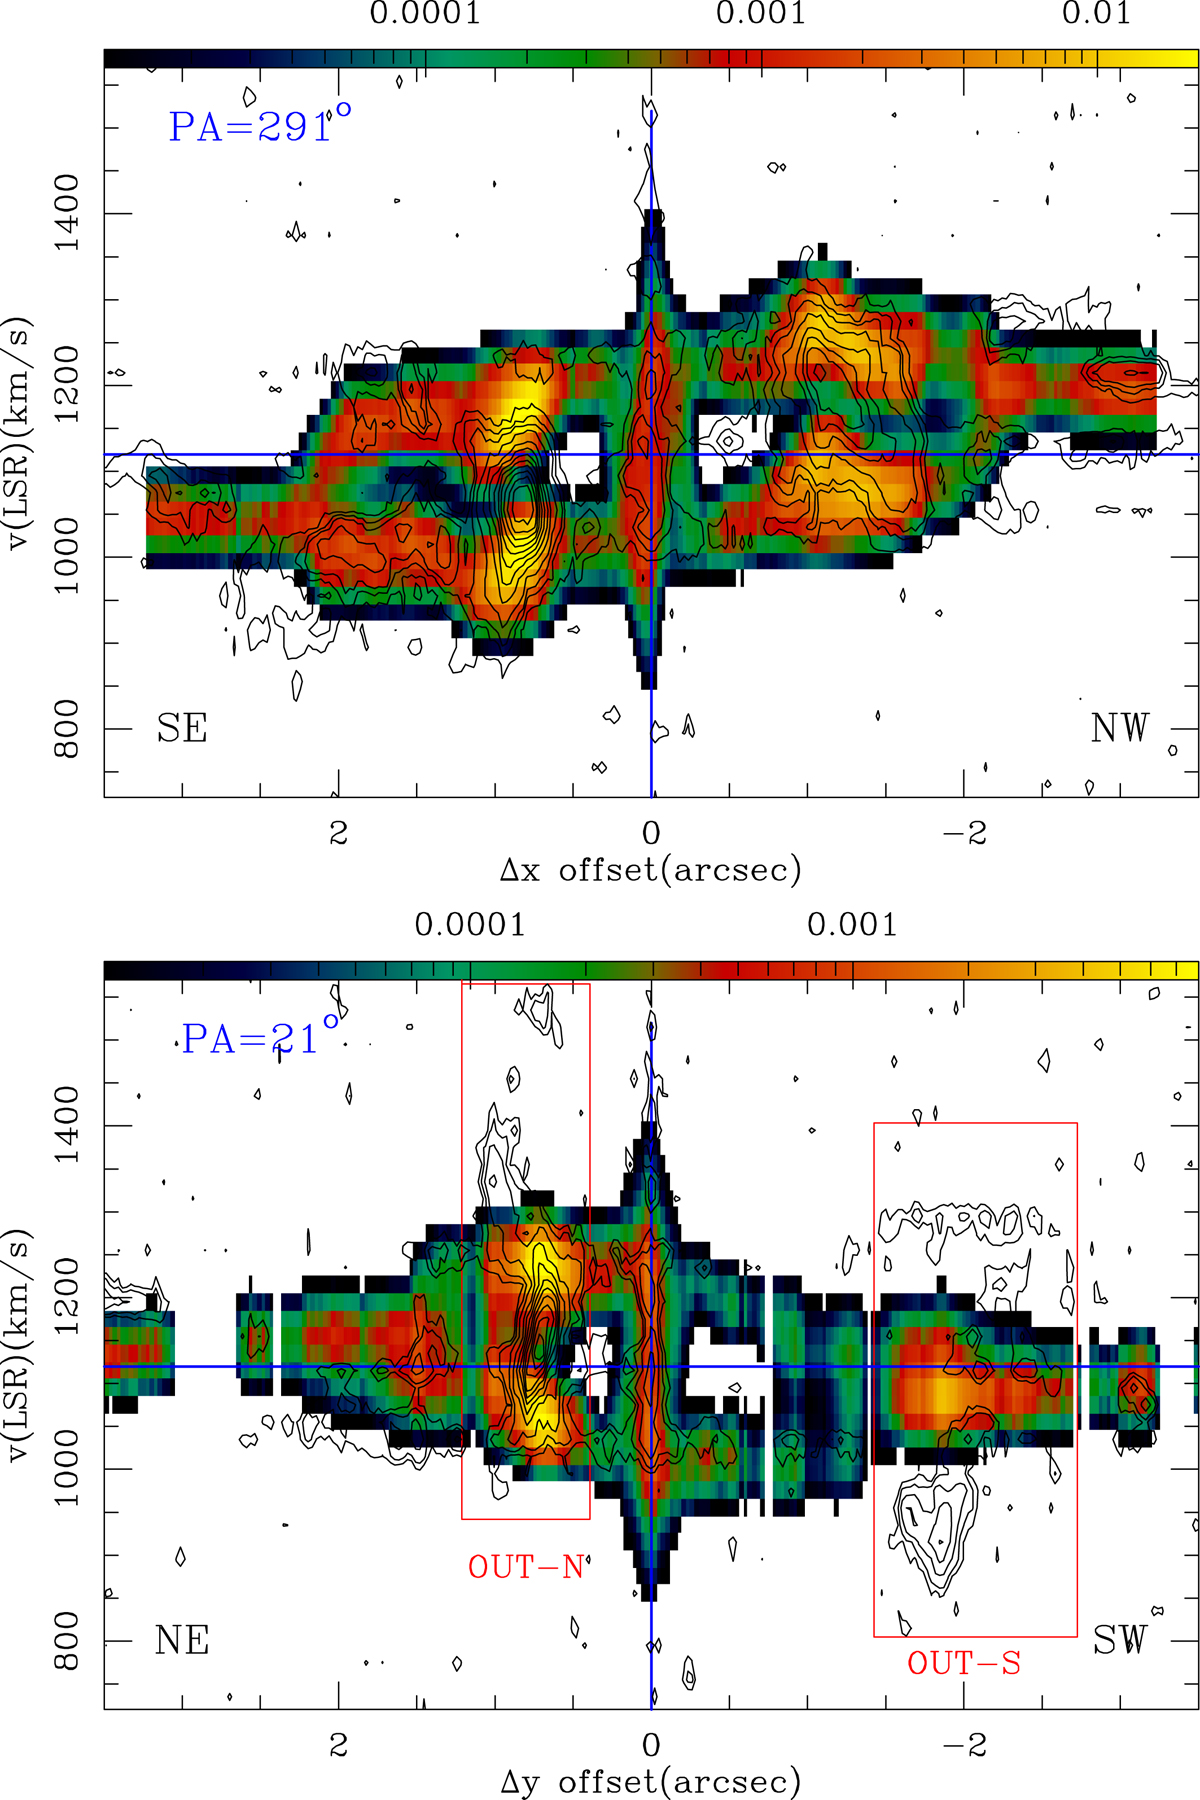
Overlay of CO(2–1) p − v plots (contours in Jy beam−1-units) along the average major axis (upper panel: PA = 291° = 180° +111°; where we adopt the orientation of the receding side of the major axis) and average minor axis (lower panel: PA = 21°) on the corresponding synthetic p − v plots (in logarithmic color scale) generated by 3DBarolo for the best-fit model described in Sect. 7. In our convention Δx-offsets are > 0 to the SE and Δy-offsets are > 0 to the NE. Contour levels in the upper panel are 1.3%, 3%, 5%, and then 10%–90% in steps of 10% of the peak value = 23.1 mJy beam−1. Contour levels in the lower panel are 2.7%, 5%, and then 10%–90% in steps of 10% of the peak value = 9.1 mJy beam−1. The regions identified as OUT-N and OUT-S in the lower panel correspond to the crossings of the AGN-wind working surface with the molecular gas at the N and S extremes of the CND.
Current usage metrics show cumulative count of Article Views (full-text article views including HTML views, PDF and ePub downloads, according to the available data) and Abstracts Views on Vision4Press platform.
Data correspond to usage on the plateform after 2015. The current usage metrics is available 48-96 hours after online publication and is updated daily on week days.
Initial download of the metrics may take a while.