Fig. 23.
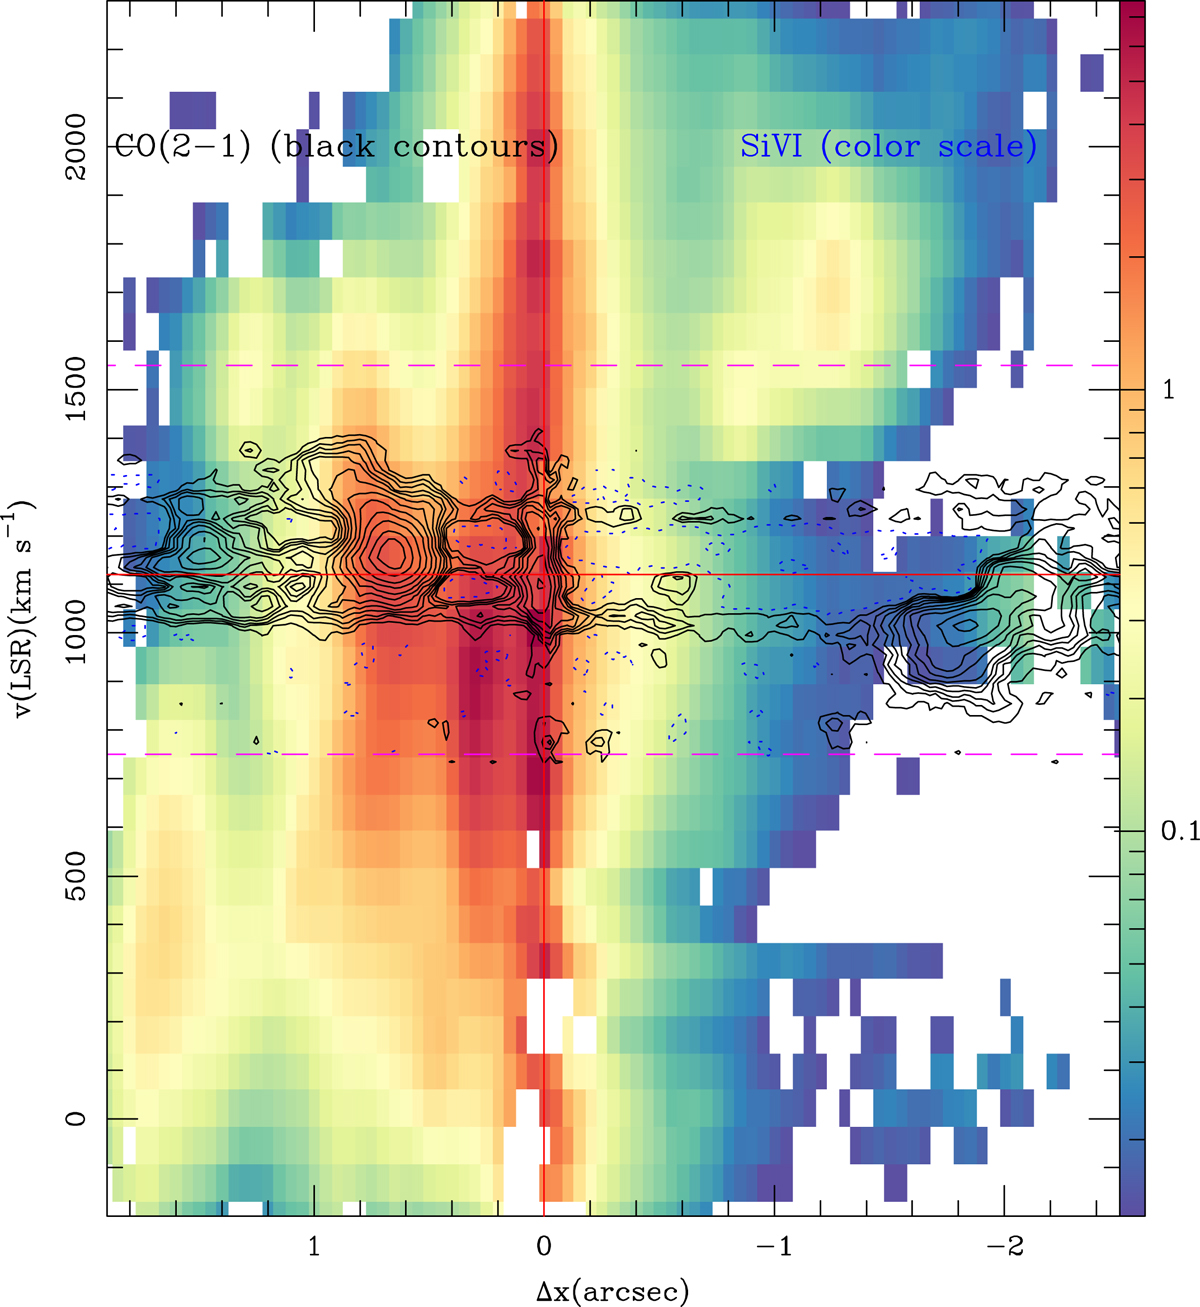
Same as Fig. 21 but showing the comparison between CO(2–1) (contours) and [SiVI] (color scale spanning the range [3σ, 1700σ]). For visualization purposes the v-scale has been highly compressed relative to that of Fig. 21 (identified by the magenta dashed lines). [SiVI] is a high-ionization line (≃205 eV) that traces the emission of high-velocity ionized gas in the outflow up to v − vsys ≃ ±800 km s−1 inside the CND region.
Current usage metrics show cumulative count of Article Views (full-text article views including HTML views, PDF and ePub downloads, according to the available data) and Abstracts Views on Vision4Press platform.
Data correspond to usage on the plateform after 2015. The current usage metrics is available 48-96 hours after online publication and is updated daily on week days.
Initial download of the metrics may take a while.