Fig. 21.
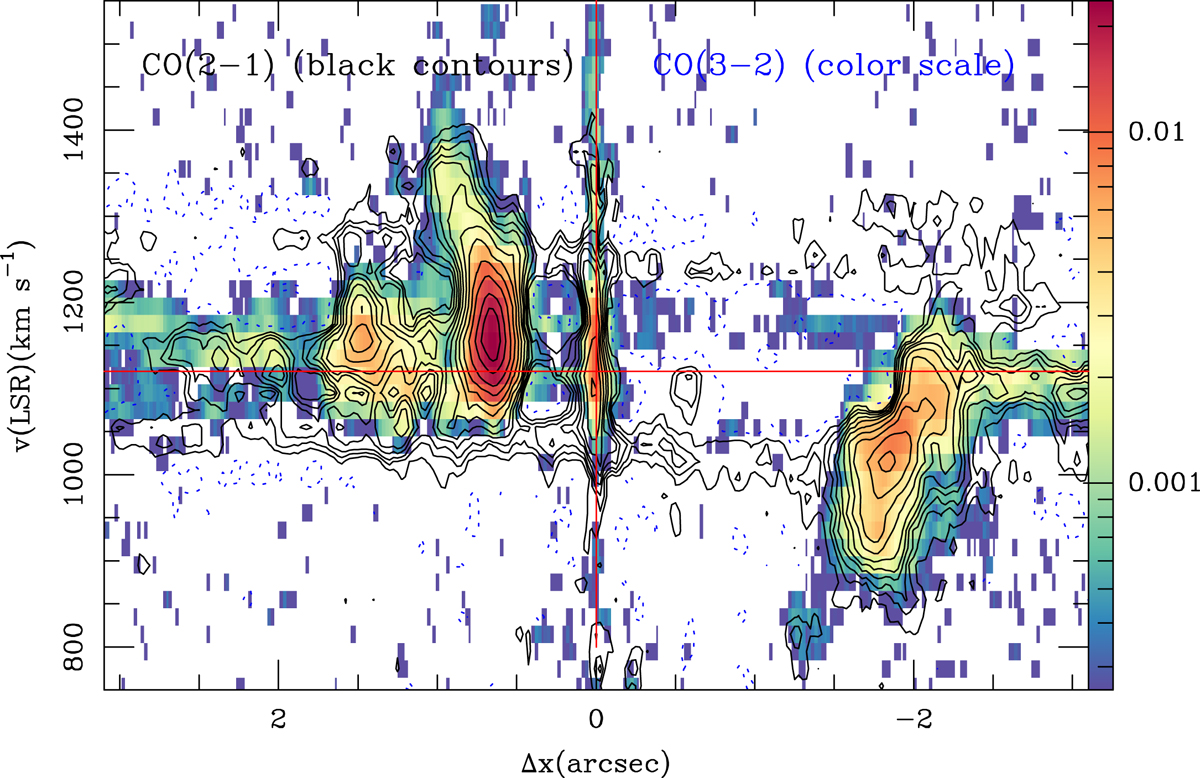
Comparison of the average position–velocity (p − v) plot obtained for the outflow region out to r = 3″ (≃210 pc) in CO(2-1): contours are −2.5σ [dashed], 2.5σ, 4σ, 6σ, 9σ, 12σ, 17σ, 25σ, 35σ, 50σ, 70σ to 160σ in steps of 30σ, with 1σ = 0.04 mJy beam−1 and CO(3–2). The color logarithmic scale is [2.5σ, 230σ] with 1σ = 0.08 mJy beam−1. The emission has been averaged using data cubes where the rotation curve model of Sect. 4.5 has been subtracted over a range of PA: [PAoutflow − 20°, PAoutflow + 20°], where PAoutflow = 30°. Offsets along the x-axis are measured in arc seconds relative to the AGN locus.
Current usage metrics show cumulative count of Article Views (full-text article views including HTML views, PDF and ePub downloads, according to the available data) and Abstracts Views on Vision4Press platform.
Data correspond to usage on the plateform after 2015. The current usage metrics is available 48-96 hours after online publication and is updated daily on week days.
Initial download of the metrics may take a while.