Fig. 20.
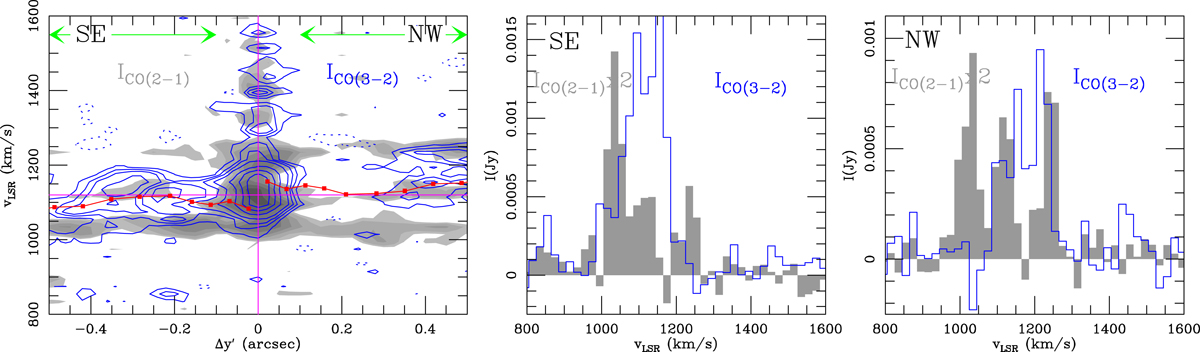
Left panel: CO position–velocity diagrams taken along the gas streamers that connect the torus with the CND at PA = –10°. The CO(2–1) line emission is shown in gray linear scale spanning the range [2σ, 18σ] with 1σ = 0.11 mJy beam−1. The CO(3–2) position–velocity diagram is shown in (blue) contours: −2σ (dashed), 2σ, 4σ, 6σ, 10σ to 40σ in steps of 10σ, with 1σ = 0.23 mJy beam−1. The (red) line and square markers show the mean velocities that can be attributed to circular rotation along PA = –10° (according to the fit of Sect. 7). The spatially integrated CO 2–1 and 3–2 line profiles averaged over the SE and NW segments of the connecting gas streamers (as defined in left panel) are shown, respectively, in the middle panel and in the right panel.
Current usage metrics show cumulative count of Article Views (full-text article views including HTML views, PDF and ePub downloads, according to the available data) and Abstracts Views on Vision4Press platform.
Data correspond to usage on the plateform after 2015. The current usage metrics is available 48-96 hours after online publication and is updated daily on week days.
Initial download of the metrics may take a while.