Fig. 2.
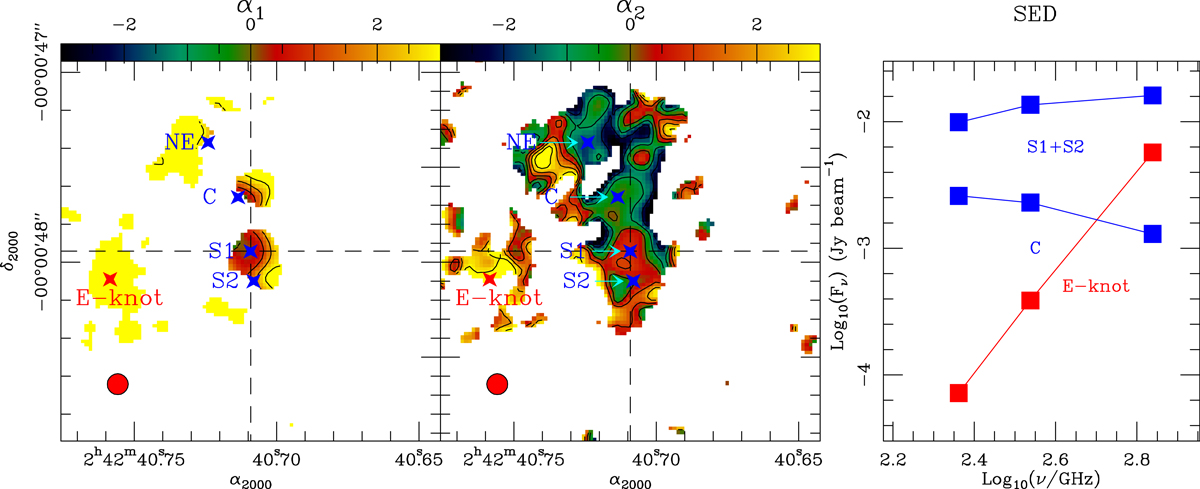
Spectral index maps (α, with Sν ∝ να) derived from the continuum emissions at ν = 344.5 GHz and 694 GHz (α1: left panel), and from ν = 229.7 GHz and 344.5 GHz (α2: middle panel). Contours span the range α = [ − 3, 3] in steps of 1. The common aperture adopted to derive the spectral index map is ![]() (red circle). The SED of continuum emission from 229.7 GHz to 694 GHz for the E-knot, the C-knot and the combined S1+S2 region are shown in the right panel.
(red circle). The SED of continuum emission from 229.7 GHz to 694 GHz for the E-knot, the C-knot and the combined S1+S2 region are shown in the right panel.
Current usage metrics show cumulative count of Article Views (full-text article views including HTML views, PDF and ePub downloads, according to the available data) and Abstracts Views on Vision4Press platform.
Data correspond to usage on the plateform after 2015. The current usage metrics is available 48-96 hours after online publication and is updated daily on week days.
Initial download of the metrics may take a while.