Fig. 19.
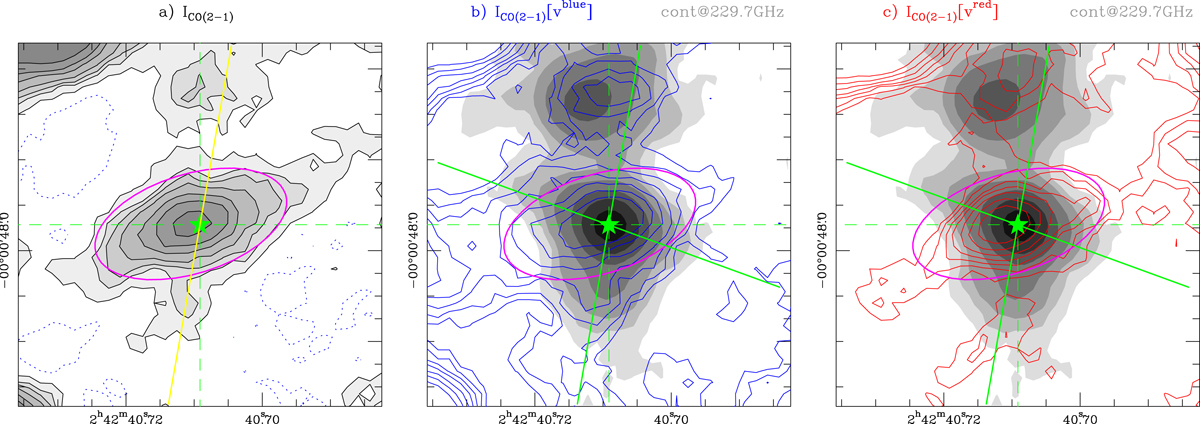
Left panel: central ![]() (≃30 pc) region of the CO(2–1) map of NGC 1068 showing the torus and its connections with the CND. The yellow line identifies the orientation of the axis chosen to derive the position–velocity diagram shown in Fig. 20 (PA = −10°). Middle and right panels: overlay of the CO(2–1) intensity contours integrated inside vblue = [vsys − 140, vsys] km s−1 (blue contours in middle panel) and vred = [vsys, vsys + 140] km s−1 (red contours in right panel) on the continuum emission image of Fig. 1 obtained at 229.7 GHz (grayscale). Blue and red contours are 2.5σ, 4σ, 6σ, 8σ, 11σ, 15σ and 20σ where 1σ = 5.8 mJy km s−1 beam−1. Gray contours are as in Fig. 1(left panel). The (solid) green lines identify the region occupied by the AGN wind. In all panels, the AGN locus is identified by the green marker and the magenta ellipse highlights the position and full size of the CO(2–1) torus as determined in Sect. 5.1.
(≃30 pc) region of the CO(2–1) map of NGC 1068 showing the torus and its connections with the CND. The yellow line identifies the orientation of the axis chosen to derive the position–velocity diagram shown in Fig. 20 (PA = −10°). Middle and right panels: overlay of the CO(2–1) intensity contours integrated inside vblue = [vsys − 140, vsys] km s−1 (blue contours in middle panel) and vred = [vsys, vsys + 140] km s−1 (red contours in right panel) on the continuum emission image of Fig. 1 obtained at 229.7 GHz (grayscale). Blue and red contours are 2.5σ, 4σ, 6σ, 8σ, 11σ, 15σ and 20σ where 1σ = 5.8 mJy km s−1 beam−1. Gray contours are as in Fig. 1(left panel). The (solid) green lines identify the region occupied by the AGN wind. In all panels, the AGN locus is identified by the green marker and the magenta ellipse highlights the position and full size of the CO(2–1) torus as determined in Sect. 5.1.
Current usage metrics show cumulative count of Article Views (full-text article views including HTML views, PDF and ePub downloads, according to the available data) and Abstracts Views on Vision4Press platform.
Data correspond to usage on the plateform after 2015. The current usage metrics is available 48-96 hours after online publication and is updated daily on week days.
Initial download of the metrics may take a while.