Fig. 18.
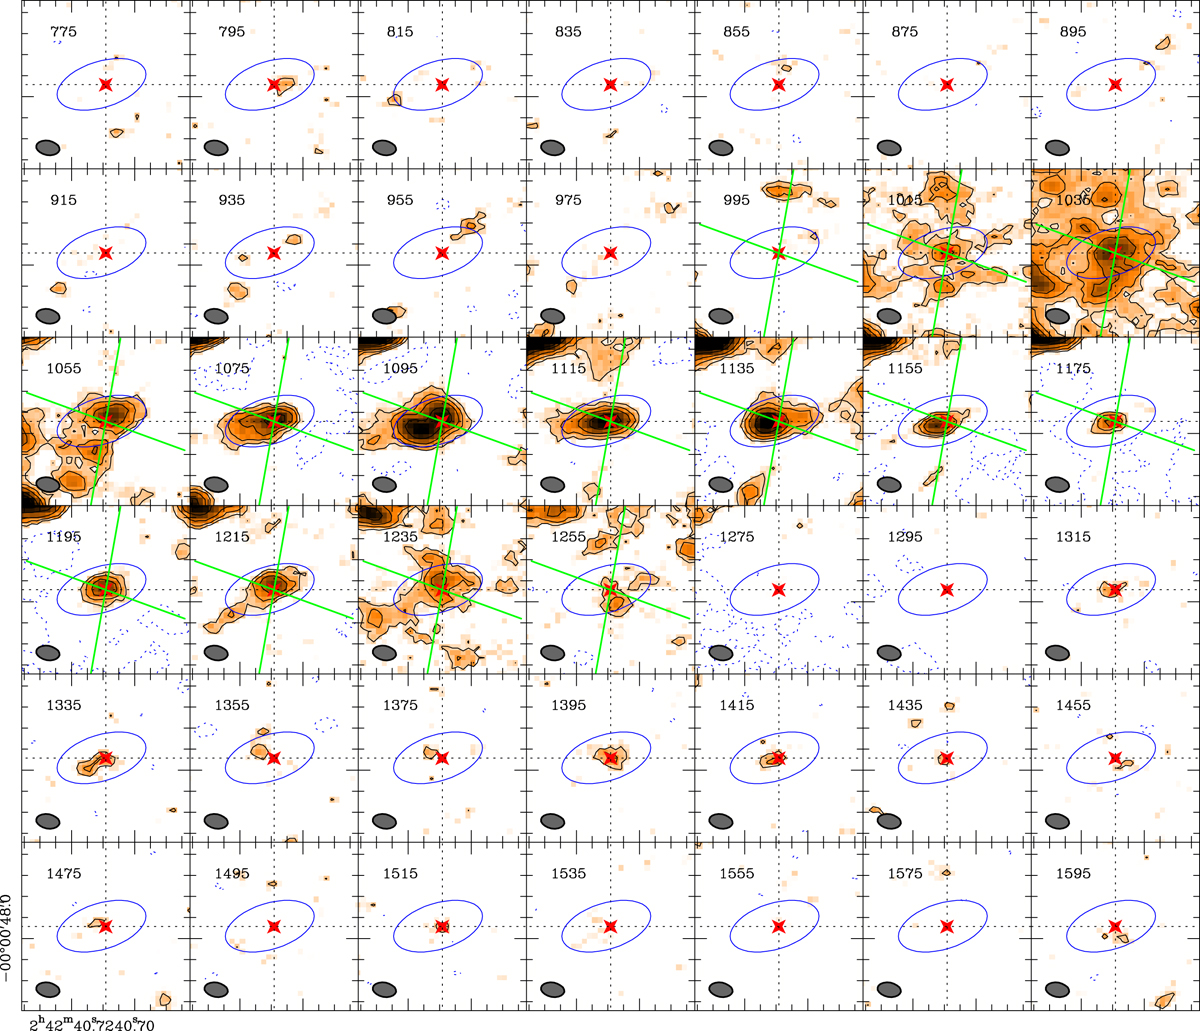
CO(2–1) channel maps obtained in the central ![]() pc × 60 pc region of NGC 1068. Intensity contours are −3σ, 3σ, 5σ, 8σ–20σ in steps of 6σ, with 1σ = 0.11 mJy beam−1. The central velocity in the LSR reference frame is displayed at the upper left corner of each panel. The position of the AGN is identified by the (red) star markers. The (gray) filled ellipses in the lower left corners of each panel represent the beam size of ALMA. The blue empty ellipses highlight the position and full size of the CO(2–1) torus as determined in Sect. 5.1. The green lines in the selected velocity channels, that is, ≃vsys ± 140 km s−1, identify the region occupied by the AGN ionized wind. The tick sizes on the x and y axes are
pc × 60 pc region of NGC 1068. Intensity contours are −3σ, 3σ, 5σ, 8σ–20σ in steps of 6σ, with 1σ = 0.11 mJy beam−1. The central velocity in the LSR reference frame is displayed at the upper left corner of each panel. The position of the AGN is identified by the (red) star markers. The (gray) filled ellipses in the lower left corners of each panel represent the beam size of ALMA. The blue empty ellipses highlight the position and full size of the CO(2–1) torus as determined in Sect. 5.1. The green lines in the selected velocity channels, that is, ≃vsys ± 140 km s−1, identify the region occupied by the AGN ionized wind. The tick sizes on the x and y axes are ![]() and
and ![]() , respectively.
, respectively.
Current usage metrics show cumulative count of Article Views (full-text article views including HTML views, PDF and ePub downloads, according to the available data) and Abstracts Views on Vision4Press platform.
Data correspond to usage on the plateform after 2015. The current usage metrics is available 48-96 hours after online publication and is updated daily on week days.
Initial download of the metrics may take a while.