Fig. 16.
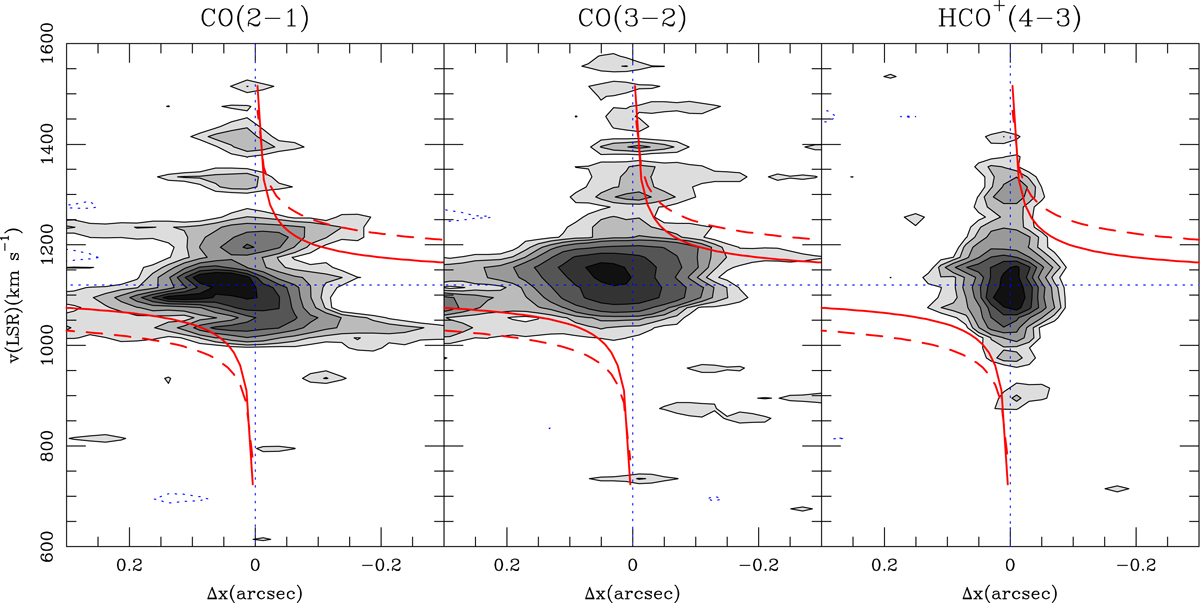
Position–velocity (p − v) diagrams obtained with the MSR data set along the major axis of the torus of NGC 1068 along PA = 113° in the J = 2 − 1 line of CO (left panel), the J = 3 − 2 line of CO (middle panel), and the J = 4 − 3 line of HCO+ (right panel). Gray-scale and contours are −2.5σ, 2.5σ, 4σ, 6σ to 18σ in steps of 3σ, with 1σ = 0.11 mJy beam−1 (left panel), −2.5σ, 2.5σ, 5σ, 8σ,12σ, 20σ, 35σ and 50σ, with 1σ = 0.23 mJy beam−1 (middle panel), and −2.5σ, 2.5σ, 4σ, 6σ, 9σ, 12σ, 15σ, and 19σ, with 1σ = 0.28 mJy beam−1 (right panel). Offsets along the x axis (Δx) are measured in arc seconds relative to the AGN locus (vertical dashed lines) with positive (negative) values corresponding to the SE (NW) side of the disk. Velocities are measured in LSR scale with ![]() km s−1 (horizontal dashed lines). The dashed (solid) red curves show the best-fit sub-Keplerian (Keplerian) rotation curve vrot ∝ r−α of Greenhill et al. (1996) with α = 0.31 (0.50); the curves were fitted to the H2O megamaser spots detected along PAmaser = 140° ±5° (Greenhill et al. 1996; Gallimore et al. 2001) and subsequently projected along PA = 113°. The curves account for a black hole mass MBH ≃ 1 × 10⁷ M⊙.
km s−1 (horizontal dashed lines). The dashed (solid) red curves show the best-fit sub-Keplerian (Keplerian) rotation curve vrot ∝ r−α of Greenhill et al. (1996) with α = 0.31 (0.50); the curves were fitted to the H2O megamaser spots detected along PAmaser = 140° ±5° (Greenhill et al. 1996; Gallimore et al. 2001) and subsequently projected along PA = 113°. The curves account for a black hole mass MBH ≃ 1 × 10⁷ M⊙.
Current usage metrics show cumulative count of Article Views (full-text article views including HTML views, PDF and ePub downloads, according to the available data) and Abstracts Views on Vision4Press platform.
Data correspond to usage on the plateform after 2015. The current usage metrics is available 48-96 hours after online publication and is updated daily on week days.
Initial download of the metrics may take a while.