Fig. 14.
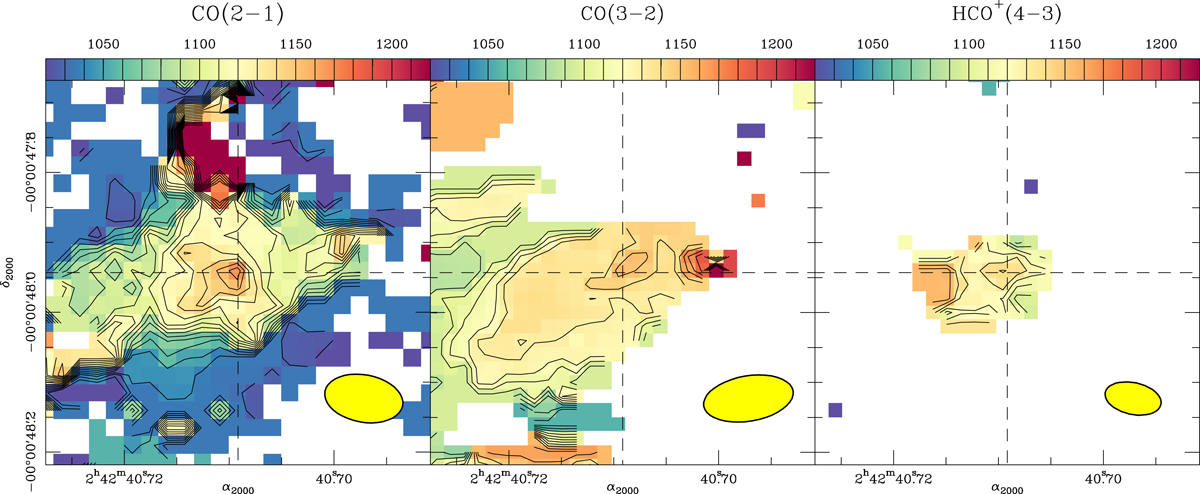
Mean-velocity fields derived from the CO(2–1) (left panel), CO(3–2) (middle panel) and HCO+(4–3) (right panel) lines in the central ![]() (≃20 pc) region around the central engine of NGC 1068. Isovelocity contours and color scale span the range [−100, 100] km s−1 relative to
(≃20 pc) region around the central engine of NGC 1068. Isovelocity contours and color scale span the range [−100, 100] km s−1 relative to ![]() km s−1 in steps of 10 km s−1. The yellow filled ellipses in the bottom right corners of the panels represent the beam sizes of ALMA.
km s−1 in steps of 10 km s−1. The yellow filled ellipses in the bottom right corners of the panels represent the beam sizes of ALMA.
Current usage metrics show cumulative count of Article Views (full-text article views including HTML views, PDF and ePub downloads, according to the available data) and Abstracts Views on Vision4Press platform.
Data correspond to usage on the plateform after 2015. The current usage metrics is available 48-96 hours after online publication and is updated daily on week days.
Initial download of the metrics may take a while.