Fig. 13.
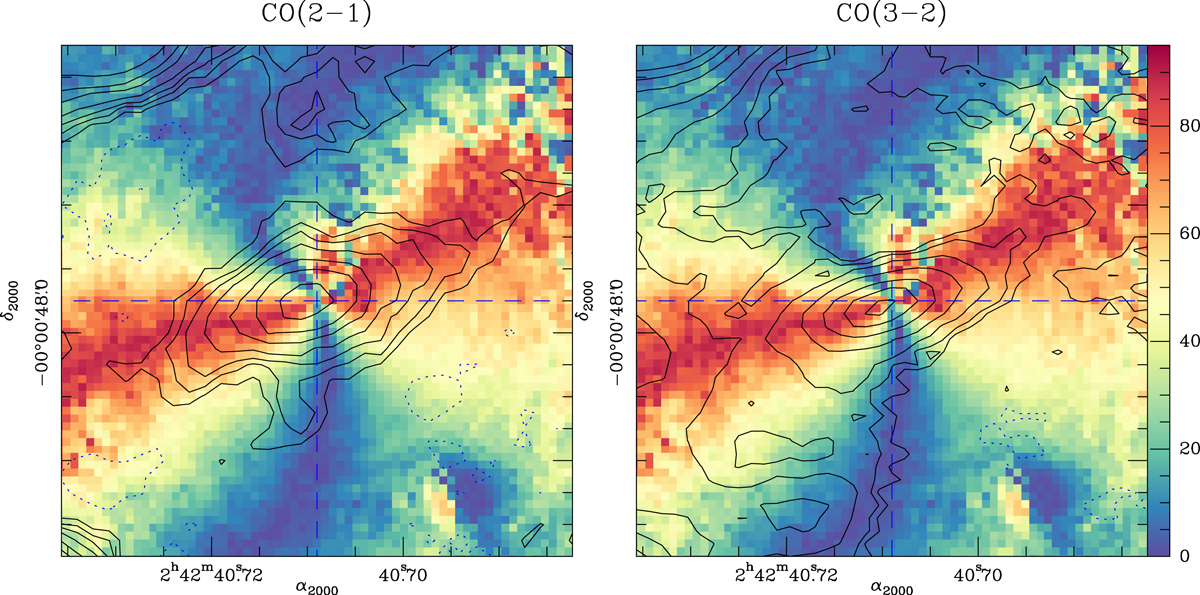
Left panel: we overlay the CO(2–1) contours of Fig. 11 on the difference between the polarization angle map and a purely centro-symmetric pattern derived from the H-band map of Gratadour et al. (2015) (in color scale in units of degrees) in the central ![]() (≃30 pc) region around the AGN of NGC 1068. Right panel: same as left panel but showing the comparison between the CO(3–2) contours and the angle map.
(≃30 pc) region around the AGN of NGC 1068. Right panel: same as left panel but showing the comparison between the CO(3–2) contours and the angle map.
Current usage metrics show cumulative count of Article Views (full-text article views including HTML views, PDF and ePub downloads, according to the available data) and Abstracts Views on Vision4Press platform.
Data correspond to usage on the plateform after 2015. The current usage metrics is available 48-96 hours after online publication and is updated daily on week days.
Initial download of the metrics may take a while.