Fig. 12.
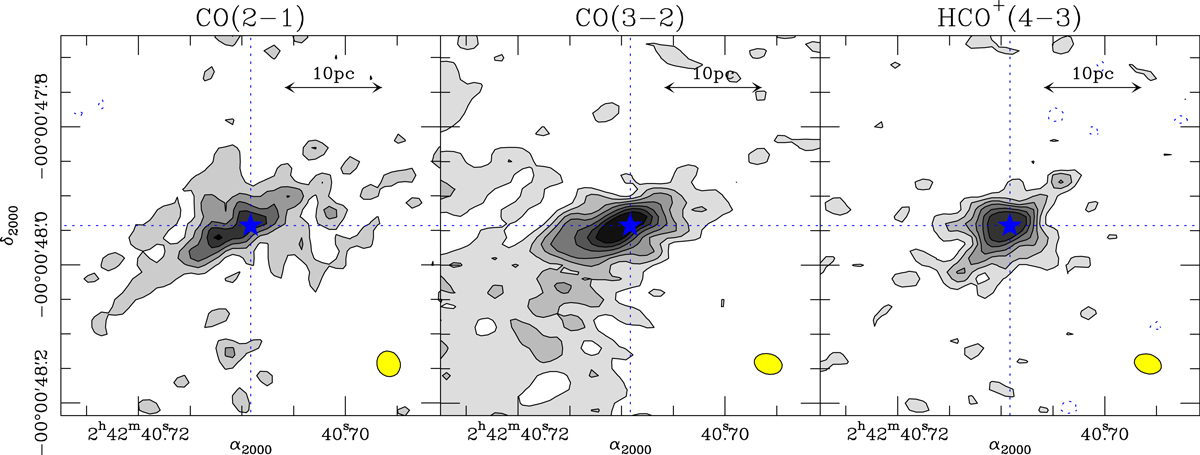
Same as Fig. 11 but showing the maps obtained using the HSR data set, as defined in Table 1. The CO(2–1) contours are: −3σ (dashed), 3σ, 5σ, 7σ, 9σ, and 11σ, where 1σ = 22 mJy km s−1 beam−1. The CO(3–2) contours are −3σ (dashed), 3σ, 5σ, 7σ, 9σ, 12σ, 15σ, and 18σ, where 1σ = 35 mJy km s−1 beam−1. The HCO+(4–3) are −3σ (dashed), 3σ, 5σ, 7σ, 9σ, 12σ and 15σ, where 1σ = 34 mJy km s−1 beam−1.
Current usage metrics show cumulative count of Article Views (full-text article views including HTML views, PDF and ePub downloads, according to the available data) and Abstracts Views on Vision4Press platform.
Data correspond to usage on the plateform after 2015. The current usage metrics is available 48-96 hours after online publication and is updated daily on week days.
Initial download of the metrics may take a while.