Fig. 11.
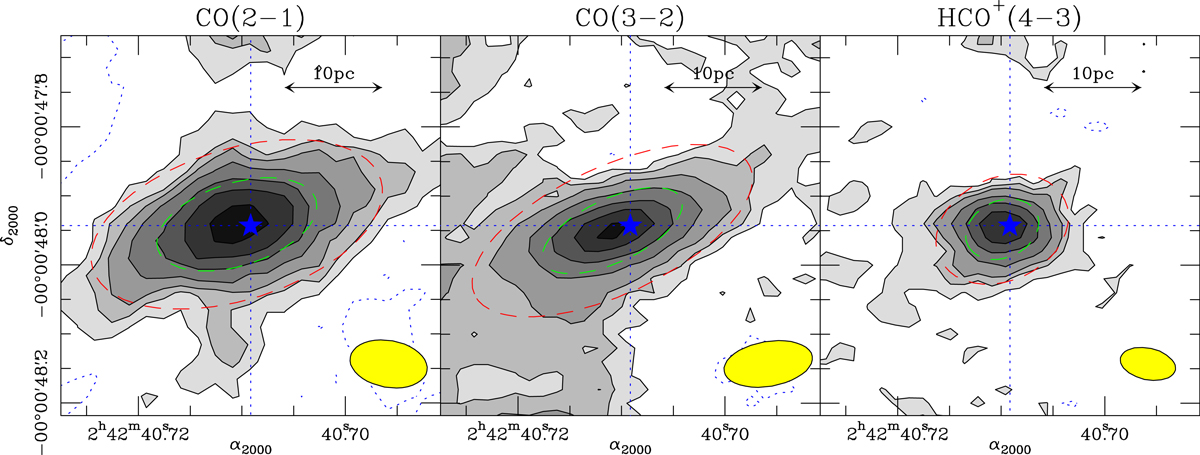
Left panel: CO(2–1) map of the central ![]() (≃20 pc) region around the central engine of NGC 1068 obtained using the MSR data set, as defined in Table 1. The image shows the molecular torus or disk and its connections. The map is shown in gray-filled contour levels: -2.5σ (dashed), 2.5σ, 5σ, 7σ, 10σ, 15σ, 20σ, and 30σ, where 1σ = 13 mJy km s−1 beam−1. Middle panel: same as left panel but showing the CO(3–2) map. Contour spacing is −2.5σ (dashed), 2.5σ, 5σ, 10σ, 10σ, 20σ, 35σ, 50σ, and 65σ, where 1σ = 27 mJy km s−1 beam−1. Right panel: same as left panel but showing the HCO+(4–3) map. Contour spacing is −2.5σ (dashed), 2.5σ, 5σ, 7σ, 12σ, 20σ, and 30σ, where 1σ = 33 mJy km s−1 beam−1. The dashed green (red) ellipses represent the FWHM sizes (full-sizes at a 3σ-level) of the Gaussian fits to the distribution of intensities of the three transitions imaged in the torus prior to deconvolution, as listed in Table 2. The position of the AGN is identified by the blue star marker. The yellow filled ellipses in the bottom right corners of the panels represent the beam sizes of ALMA.
(≃20 pc) region around the central engine of NGC 1068 obtained using the MSR data set, as defined in Table 1. The image shows the molecular torus or disk and its connections. The map is shown in gray-filled contour levels: -2.5σ (dashed), 2.5σ, 5σ, 7σ, 10σ, 15σ, 20σ, and 30σ, where 1σ = 13 mJy km s−1 beam−1. Middle panel: same as left panel but showing the CO(3–2) map. Contour spacing is −2.5σ (dashed), 2.5σ, 5σ, 10σ, 10σ, 20σ, 35σ, 50σ, and 65σ, where 1σ = 27 mJy km s−1 beam−1. Right panel: same as left panel but showing the HCO+(4–3) map. Contour spacing is −2.5σ (dashed), 2.5σ, 5σ, 7σ, 12σ, 20σ, and 30σ, where 1σ = 33 mJy km s−1 beam−1. The dashed green (red) ellipses represent the FWHM sizes (full-sizes at a 3σ-level) of the Gaussian fits to the distribution of intensities of the three transitions imaged in the torus prior to deconvolution, as listed in Table 2. The position of the AGN is identified by the blue star marker. The yellow filled ellipses in the bottom right corners of the panels represent the beam sizes of ALMA.
Current usage metrics show cumulative count of Article Views (full-text article views including HTML views, PDF and ePub downloads, according to the available data) and Abstracts Views on Vision4Press platform.
Data correspond to usage on the plateform after 2015. The current usage metrics is available 48-96 hours after online publication and is updated daily on week days.
Initial download of the metrics may take a while.