Fig. 10.
Spectra extracted at [Δα, Δδ] = [![]() +0
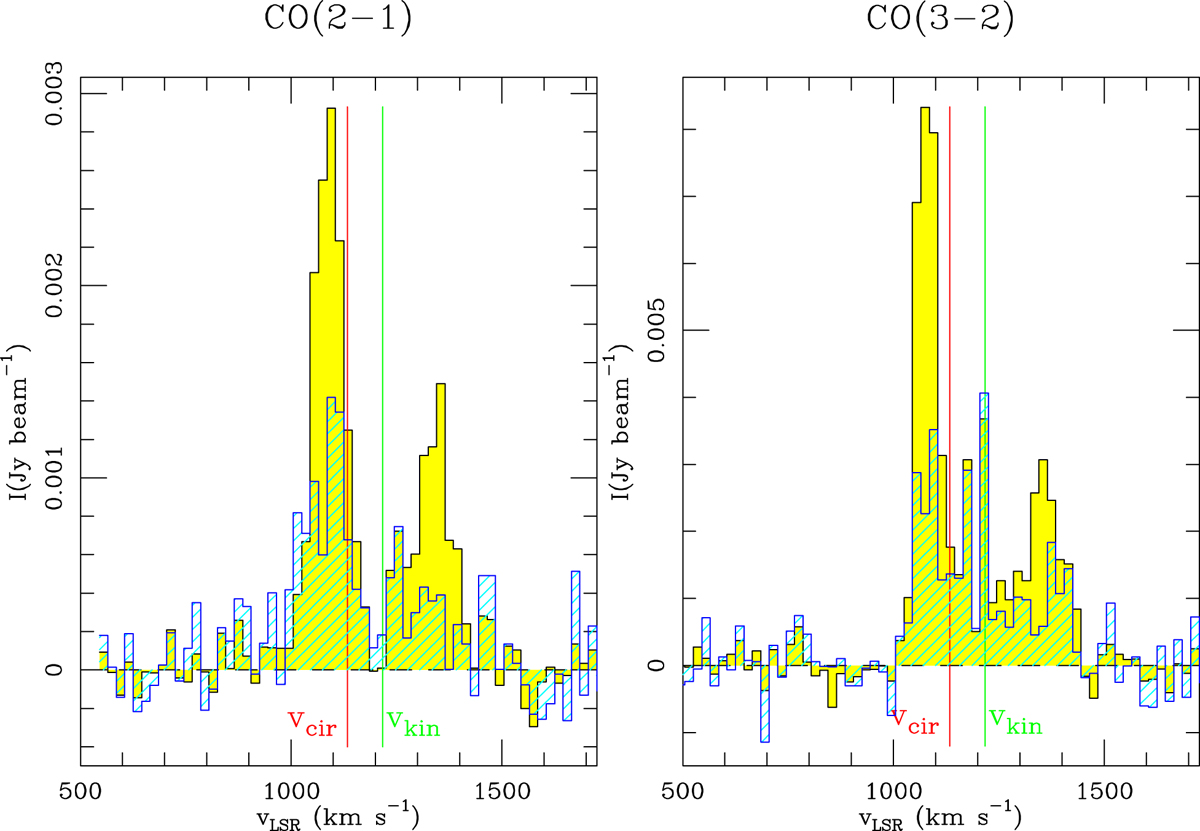
+0![]() 94] from the MSR data sets for the J = 2 − 1 line of CO (left panel) and the J = 3 − 2 line of CO (right panel) in yellow-filled histograms; these spectra were extracted using a common aperture of ≃6–7 pc. We also show in blue-hatched histograms the corresponding spectra obtained from the HSR data sets using a common aperture of ≃2–3 pc. The green line highlights the radial velocity predicted by kinemetry, which accounts for the contribution of a co-planar outflowing component (vkin). We also indicate by the red line the radial velocity due to circular motions predicted by the kinemetry best-fit model (vcir).
94] from the MSR data sets for the J = 2 − 1 line of CO (left panel) and the J = 3 − 2 line of CO (right panel) in yellow-filled histograms; these spectra were extracted using a common aperture of ≃6–7 pc. We also show in blue-hatched histograms the corresponding spectra obtained from the HSR data sets using a common aperture of ≃2–3 pc. The green line highlights the radial velocity predicted by kinemetry, which accounts for the contribution of a co-planar outflowing component (vkin). We also indicate by the red line the radial velocity due to circular motions predicted by the kinemetry best-fit model (vcir).
Current usage metrics show cumulative count of Article Views (full-text article views including HTML views, PDF and ePub downloads, according to the available data) and Abstracts Views on Vision4Press platform.
Data correspond to usage on the plateform after 2015. The current usage metrics is available 48-96 hours after online publication and is updated daily on week days.
Initial download of the metrics may take a while.