Fig. 1.
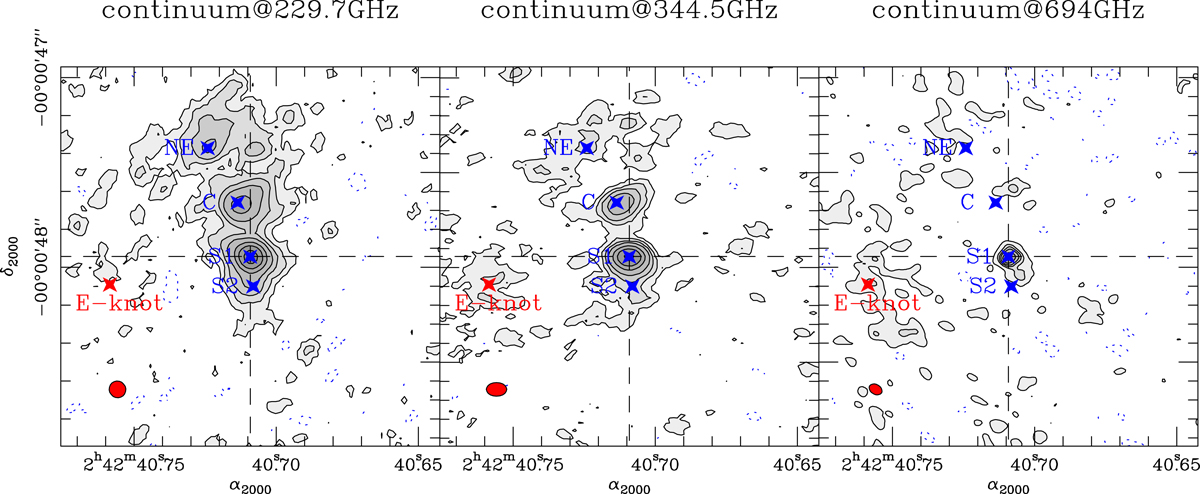
Left panel: continuum emission map of the central r ≤ 1″ (70 pc) region of NGC 1068 obtained with ALMA at 229.7 GHz (1306 μm). The map is shown in grayscale with contour levels -2σ (dashed contour), 2σ, 5σ, 10σ, 20σ, 50σ, 100σ, and 200σ, where 1σ = 30 μJy beam−1. Middle panel: same as left panel but showing the continuum emission at 344.5 GHz (871 μm). Contour spacing is as in left panel, but with 1σ = 50 μJy beam−1. Right panel: same as left panel but showing the continuum emission at 694 GHz (432 μm) published by García-Burillo et al. (2016). Contour levels are −2σ (dashed contour), 2σ, 5σ, 7σ, 9σ, 12σ, and 16σ, where 1σ = 0.5 mJy beam−1. The (red) filled ellipses at the bottom left corners of the panels represent the beam sizes of ALMA at 229.7 GHz (![]() at PA = 40°), 344.5 GHz (
at PA = 40°), 344.5 GHz (![]() at PA = 90°) and 694 GHz (
at PA = 90°) and 694 GHz (![]() at PA = 60°). The AGN lies at the intersection of the dashed lines: α2000 = 02h42m40.709s,
at PA = 60°). The AGN lies at the intersection of the dashed lines: α2000 = 02h42m40.709s, ![]() (S1 knot). We highlight the position of other radio continuum knots (S2, C and NE) as given in the VLBI maps of Gallimore et al. (1996, 2004), and the E-knot, characterized by strong dust continuum and molecular line emission (García-Burillo et al. 2014; Viti et al. 2014).
(S1 knot). We highlight the position of other radio continuum knots (S2, C and NE) as given in the VLBI maps of Gallimore et al. (1996, 2004), and the E-knot, characterized by strong dust continuum and molecular line emission (García-Burillo et al. 2014; Viti et al. 2014).
Current usage metrics show cumulative count of Article Views (full-text article views including HTML views, PDF and ePub downloads, according to the available data) and Abstracts Views on Vision4Press platform.
Data correspond to usage on the plateform after 2015. The current usage metrics is available 48-96 hours after online publication and is updated daily on week days.
Initial download of the metrics may take a while.