Fig. 8.
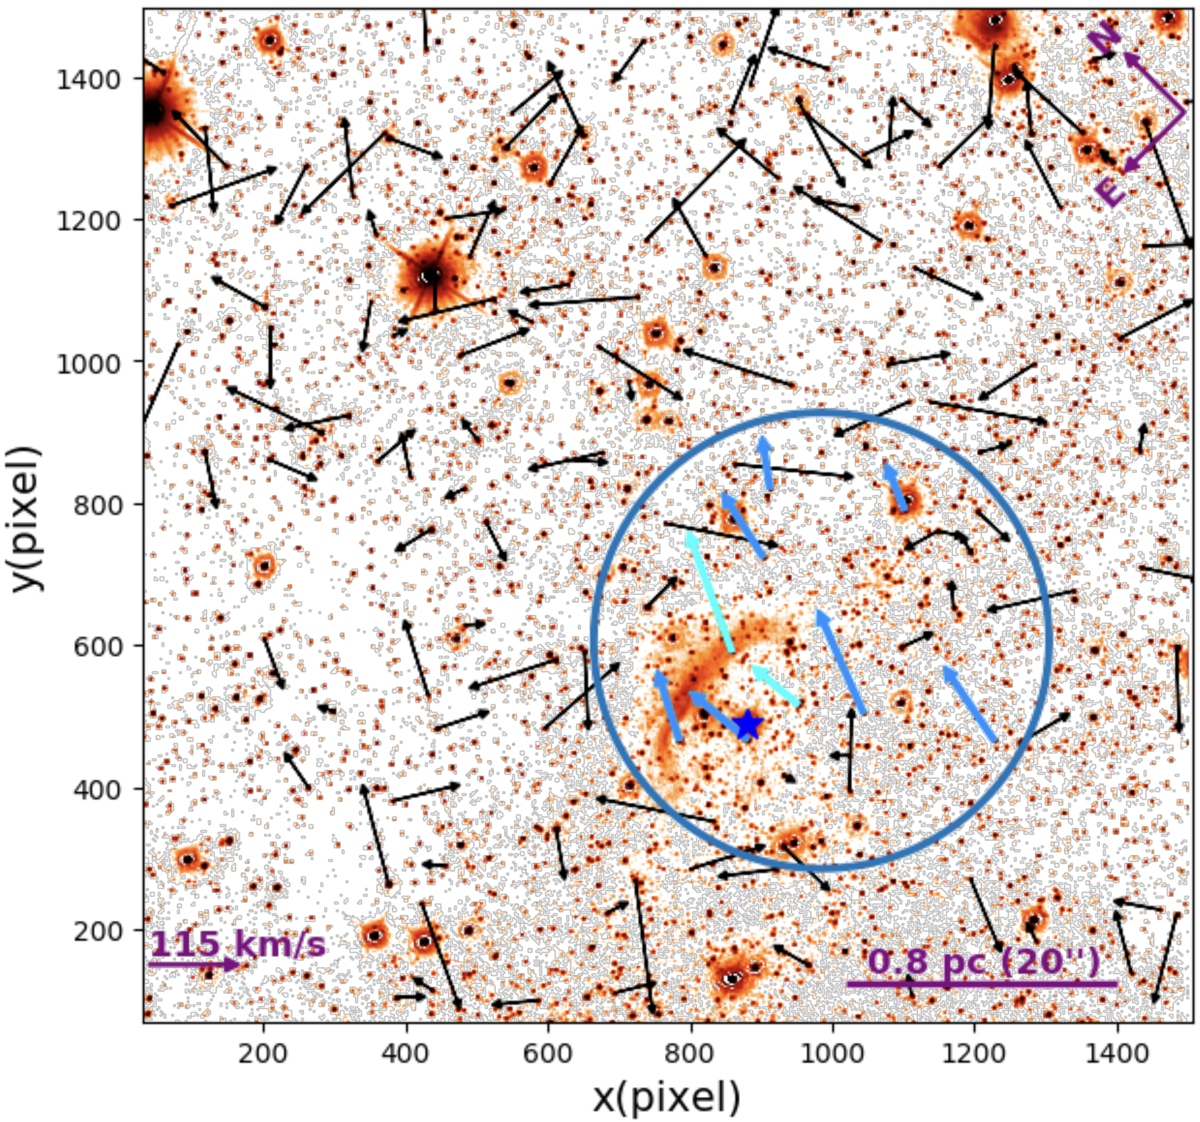
Proper motion measurements from GNS and PαS. The blue arrows surrounded by a blue circle present the co-moving group of stars in the H1 HII region. The cyan arrows show the foreground stars identified with the CMD, which we do not include in our cluster analysis. The blue star shows a Paschen-α emitting source (Dong et al. 2017).
Current usage metrics show cumulative count of Article Views (full-text article views including HTML views, PDF and ePub downloads, according to the available data) and Abstracts Views on Vision4Press platform.
Data correspond to usage on the plateform after 2015. The current usage metrics is available 48-96 hours after online publication and is updated daily on week days.
Initial download of the metrics may take a while.