Fig. 7.
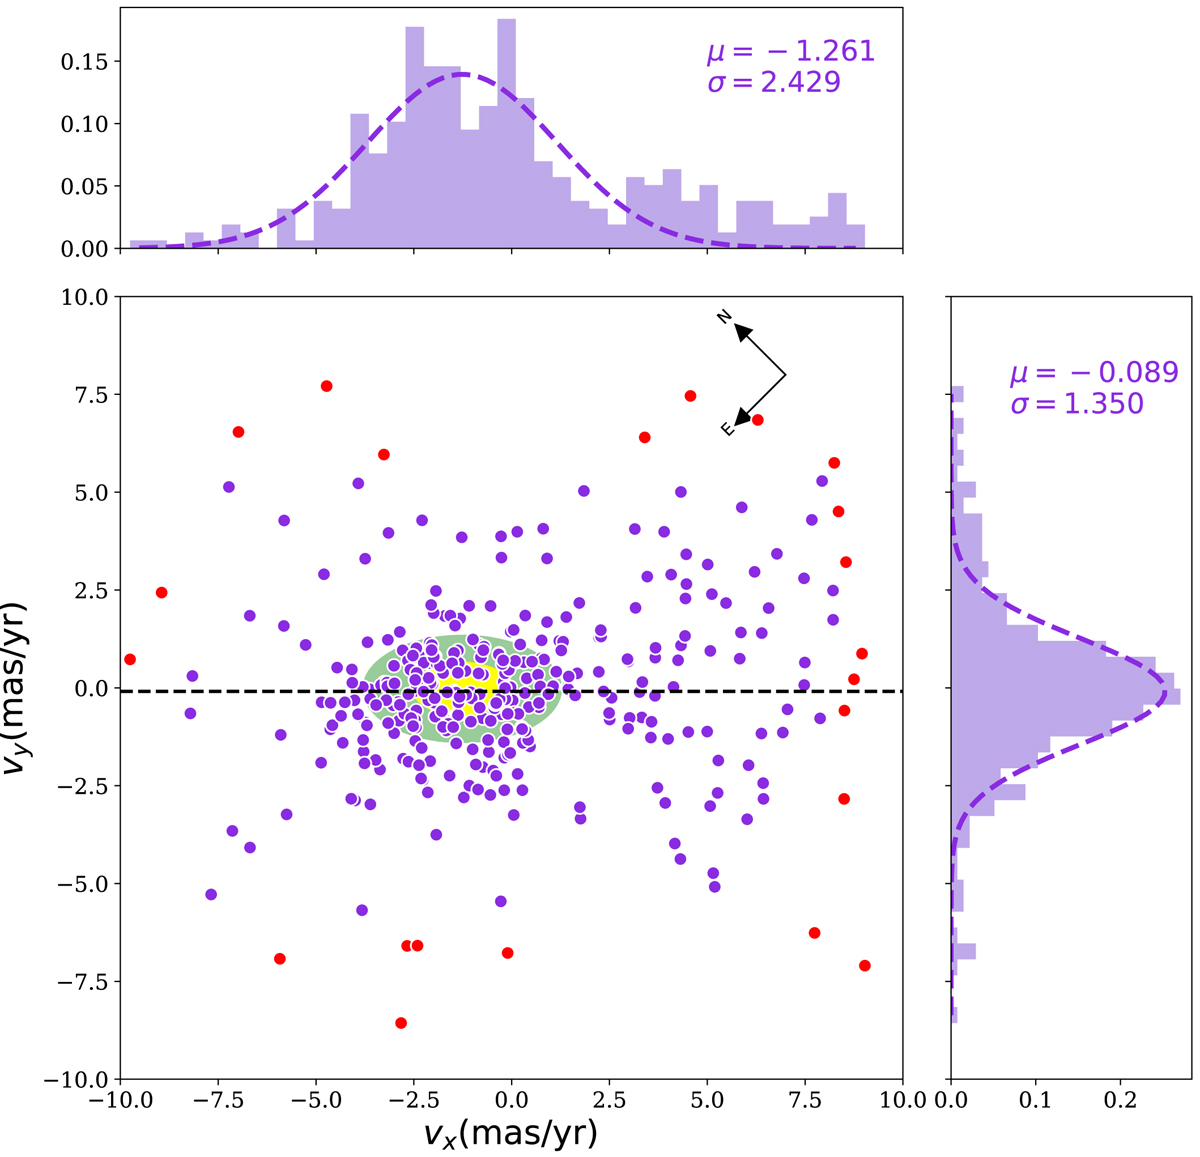
Vector-point diagram of proper motions for region of Quintuplet cluster. The yellow and green ellipses show 1σ and 2σ distributions for a 2D Gaussian fit, respectively. The dashed line shows the Galactic plane orientation. Top and right panels: histogram distributions of vx and vy, as well as their Gaussian fits with μ and σ showing the mean and standard deviation of the distributions in mas yr−1. The motion parallel to the Galactic plane (vx) presents a tail of field sources, whereas the motion perpendicular to the plane (vy) is dominated by velocity dispersion. Violet points show the stars with significant proper motions and the red points the non-significant ones.
Current usage metrics show cumulative count of Article Views (full-text article views including HTML views, PDF and ePub downloads, according to the available data) and Abstracts Views on Vision4Press platform.
Data correspond to usage on the plateform after 2015. The current usage metrics is available 48-96 hours after online publication and is updated daily on week days.
Initial download of the metrics may take a while.