Free Access
Fig. 4.
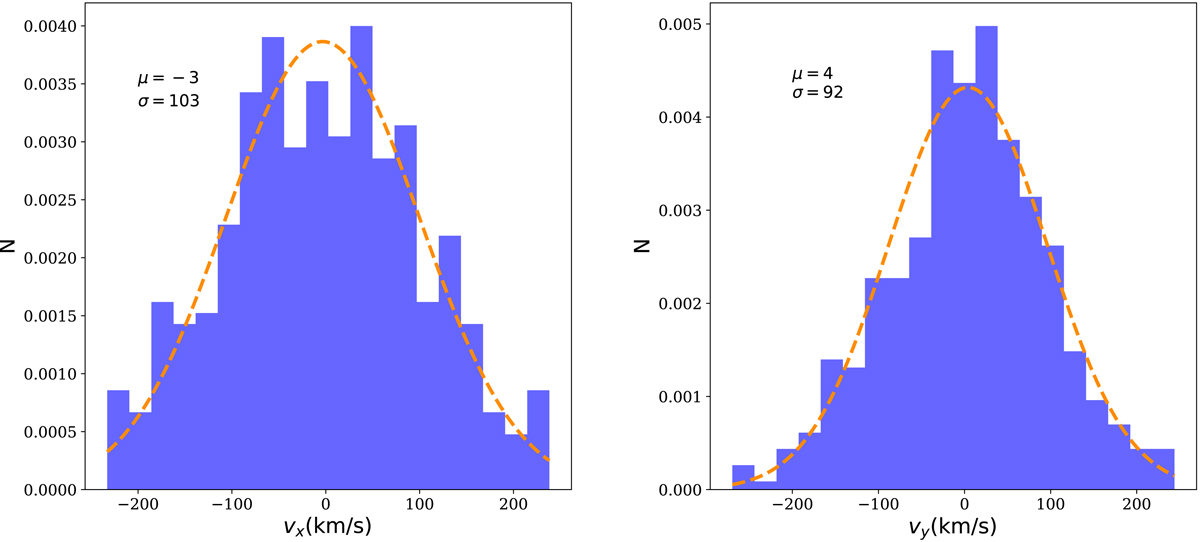
Normalised velocity distributions of stars in F19 chip #1 in two directions: parallel (left panel) and perpendicular (right panel) to the Galactic plane. The mean and standard deviation of the distributions are shown in km s−1 as μ and σ. The dashed orange lines are the fits to the histograms with Gaussian functions.
Current usage metrics show cumulative count of Article Views (full-text article views including HTML views, PDF and ePub downloads, according to the available data) and Abstracts Views on Vision4Press platform.
Data correspond to usage on the plateform after 2015. The current usage metrics is available 48-96 hours after online publication and is updated daily on week days.
Initial download of the metrics may take a while.