Free Access
Fig. B.1.
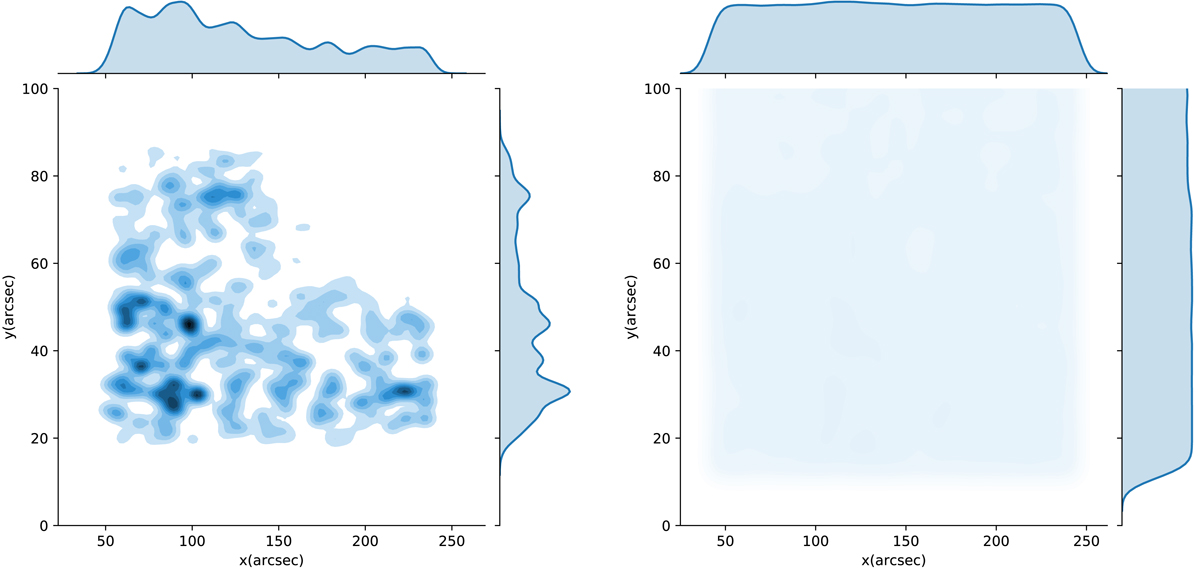
Left: density map of dis_vmin for stars of F19, chip #1. The densest region is where the co-moving group of stars is located, and it also consists of the foreground stars since they move coherently with the rest of the stars in the group. Right: density map of dis_vmin for simulated stars.
Current usage metrics show cumulative count of Article Views (full-text article views including HTML views, PDF and ePub downloads, according to the available data) and Abstracts Views on Vision4Press platform.
Data correspond to usage on the plateform after 2015. The current usage metrics is available 48-96 hours after online publication and is updated daily on week days.
Initial download of the metrics may take a while.