Fig. 11.
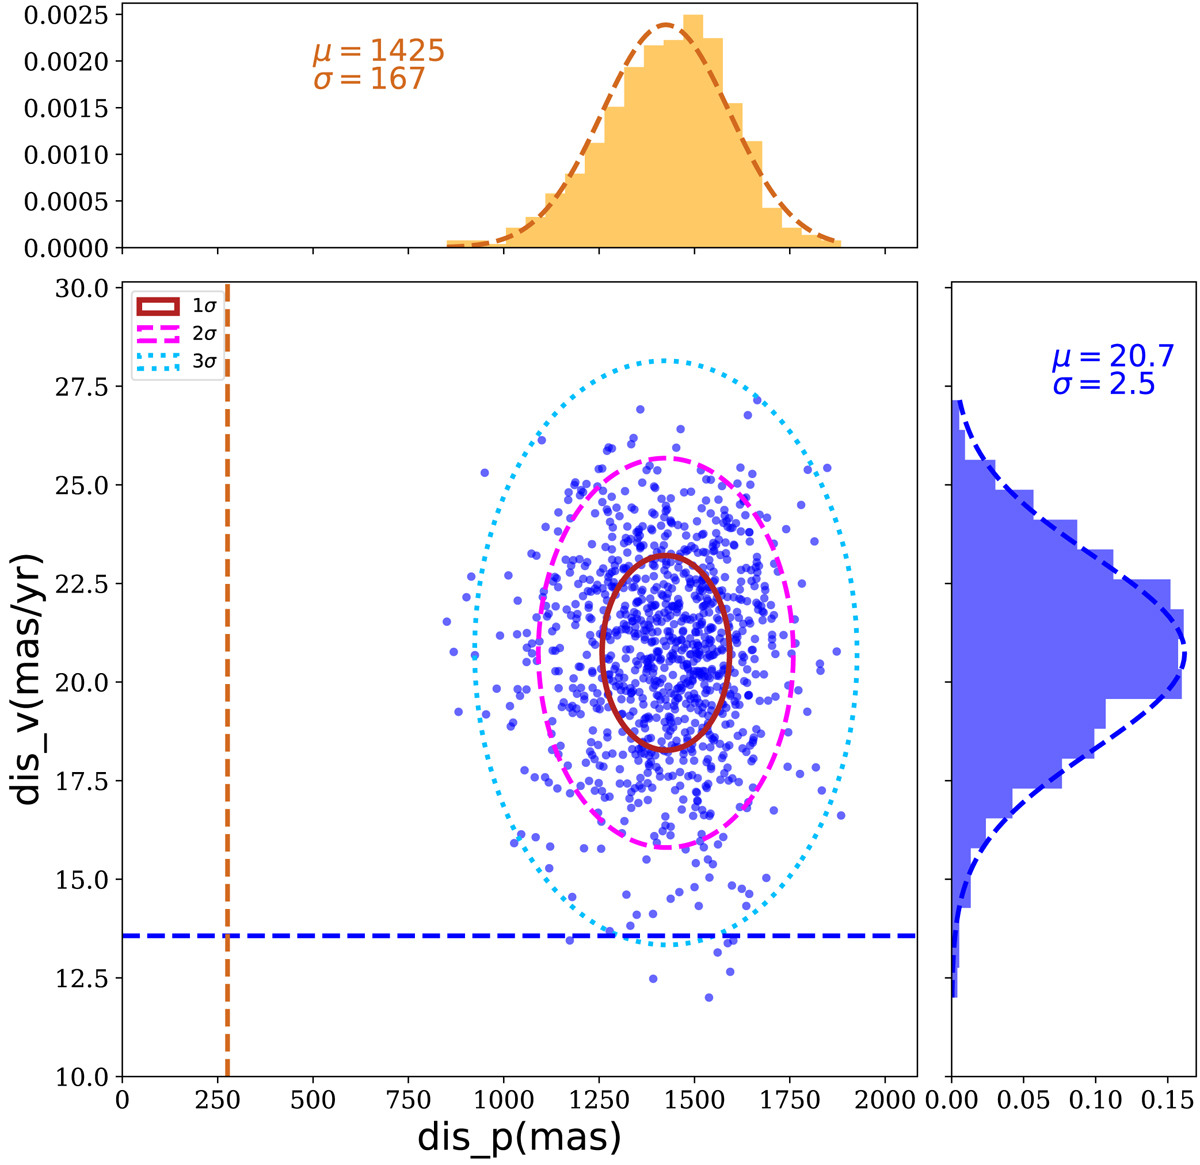
Distribution of position closeness (dis_p) and velocity compactness (dis_v) for simulated compact population of stars with its confidence intervals (1σ, 2σ, 3σ) together with histograms and their Gaussian fits. Mean and standard deviation of the dis_p and dis_v distributions are shown as μ and σ, in mas and mas yr−1, respectively. Dashed orange and blue lines indicate, respectively, the observed dis_p and dis_v for the co-moving group of stars.
Current usage metrics show cumulative count of Article Views (full-text article views including HTML views, PDF and ePub downloads, according to the available data) and Abstracts Views on Vision4Press platform.
Data correspond to usage on the plateform after 2015. The current usage metrics is available 48-96 hours after online publication and is updated daily on week days.
Initial download of the metrics may take a while.