Free Access
Fig. 10.
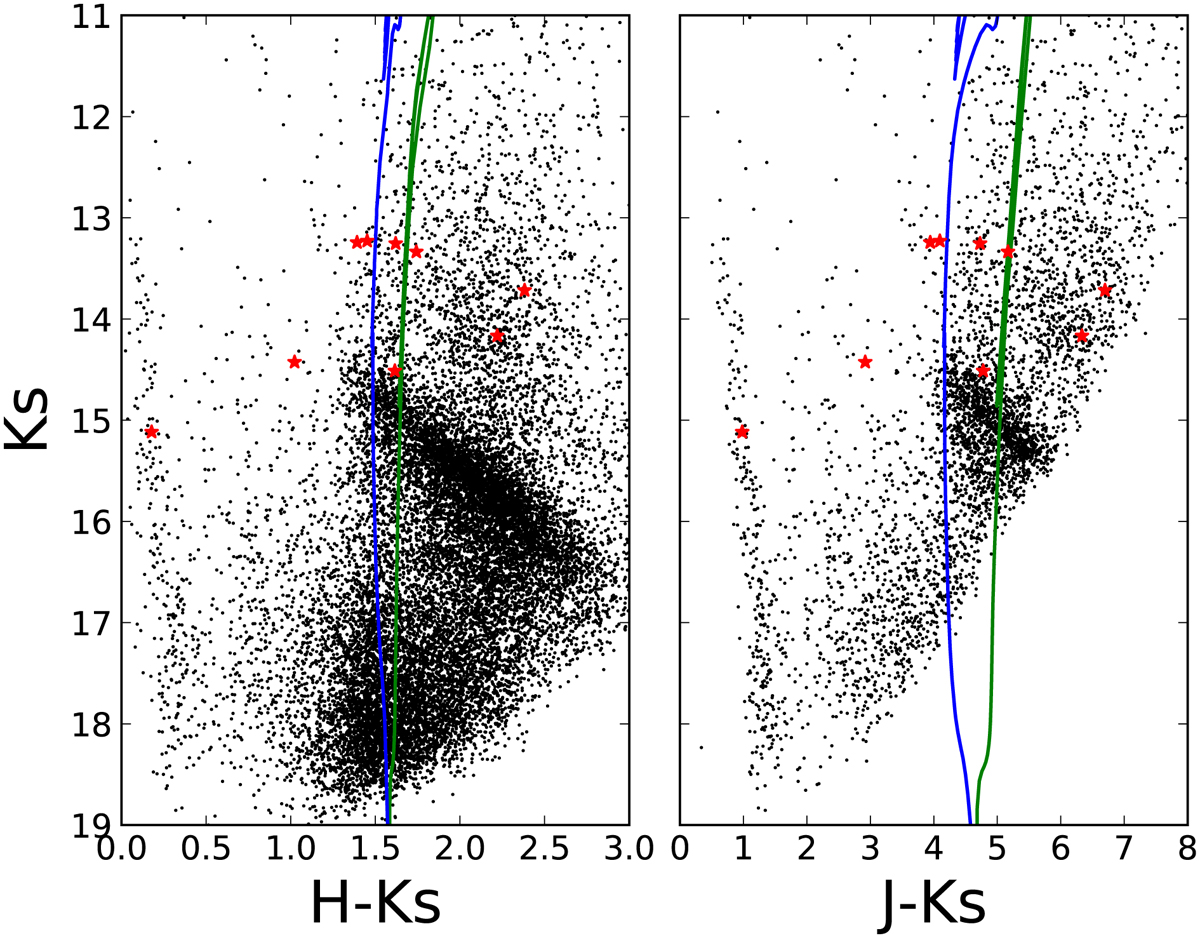
Colour-magnitude diagram of the stars in chip #1 of F19 with available HAWK-I/VLT magnitudes. The region with the highest density of stars indicates the red clump. The co-moving group of stars are marked in red. Two BaSTI isochrones of 30 Myr (blue) and 8 Gyr (green) are presented in each plot (see text in Sect. 3.3).
Current usage metrics show cumulative count of Article Views (full-text article views including HTML views, PDF and ePub downloads, according to the available data) and Abstracts Views on Vision4Press platform.
Data correspond to usage on the plateform after 2015. The current usage metrics is available 48-96 hours after online publication and is updated daily on week days.
Initial download of the metrics may take a while.