Fig. 2.
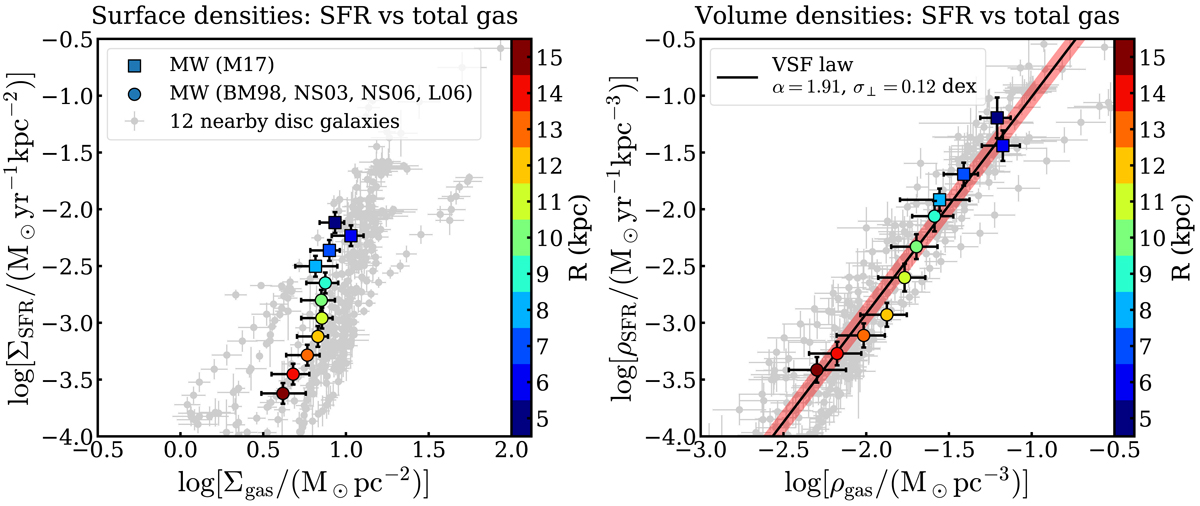
Correlations between the surface density (left) and the volume density (right) of the gas and the SFR in the MW, colour-coded according to the Galactocentric radius. The squares indicate measurements for R ≤ R⊙ from Marasco et al. (2017), while the circles are for R > R⊙ from Binney & Merrifield (1998), Nakanishi & Sofue (2003, 2006), and Levine et al. (2006) (see text). The grey points are the corresponding quantites for the sample of 12 nearby disc galaxies (see Figs. 5 and 6 in B19 for the whole range of densities). The solid line in the right panel is the VSF law from B19 with its intrinsic scatter (red band).
Current usage metrics show cumulative count of Article Views (full-text article views including HTML views, PDF and ePub downloads, according to the available data) and Abstracts Views on Vision4Press platform.
Data correspond to usage on the plateform after 2015. The current usage metrics is available 48-96 hours after online publication and is updated daily on week days.
Initial download of the metrics may take a while.