Fig. 3.
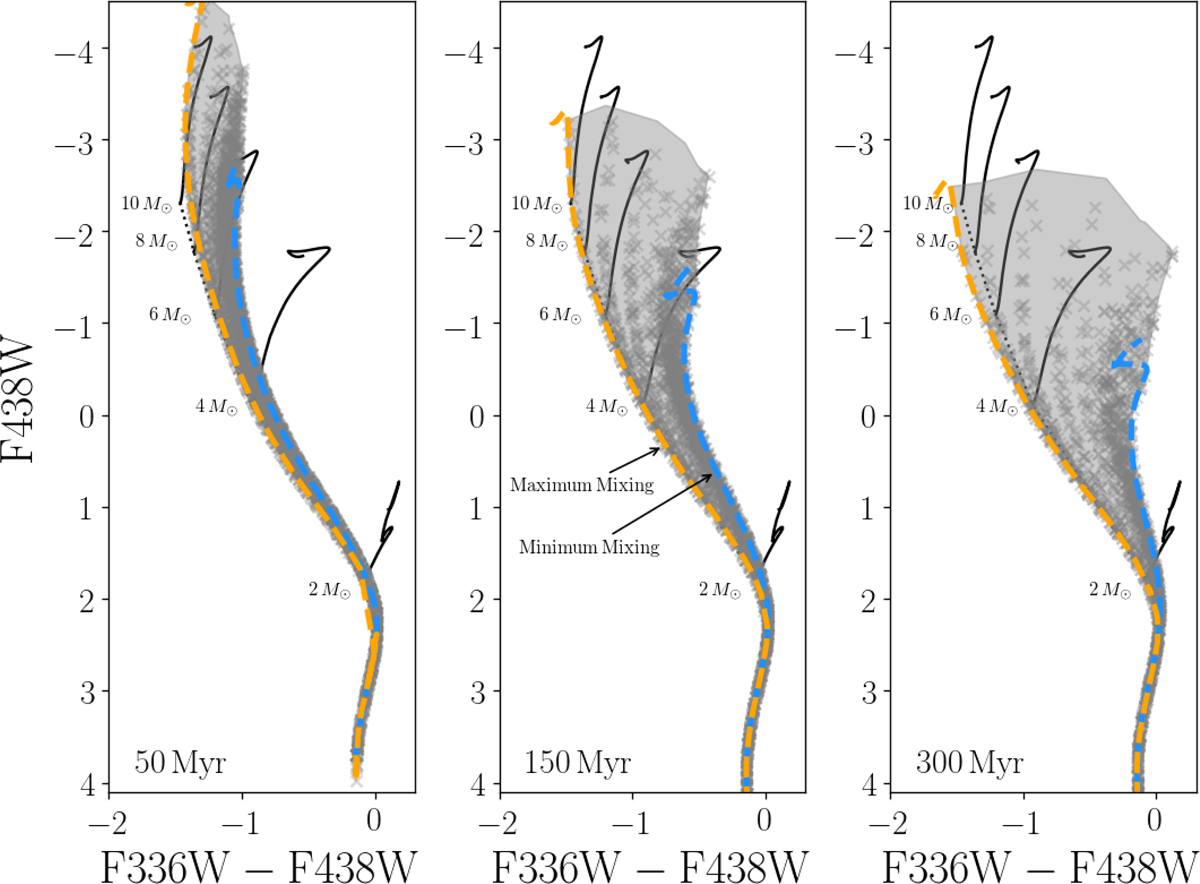
Example isochrone-clouds (grey-region) as a function of age. Isochrone-clouds shown at 35 Myr (left), 100 Myr (middle), and 150 Myr (right), with individual isochrones plotted as grey point, and evolutionary tracks over-plotted in black. The masses for the evolutionary tracks are denoted at the ZAMS for each track. The blue dashed line denotes the isochrone with the minimum amount of interior mixing and the orange dashed line represents the isochrone with the maximum amount of interior mixing in our model grid.
Current usage metrics show cumulative count of Article Views (full-text article views including HTML views, PDF and ePub downloads, according to the available data) and Abstracts Views on Vision4Press platform.
Data correspond to usage on the plateform after 2015. The current usage metrics is available 48-96 hours after online publication and is updated daily on week days.
Initial download of the metrics may take a while.