Fig. 2.
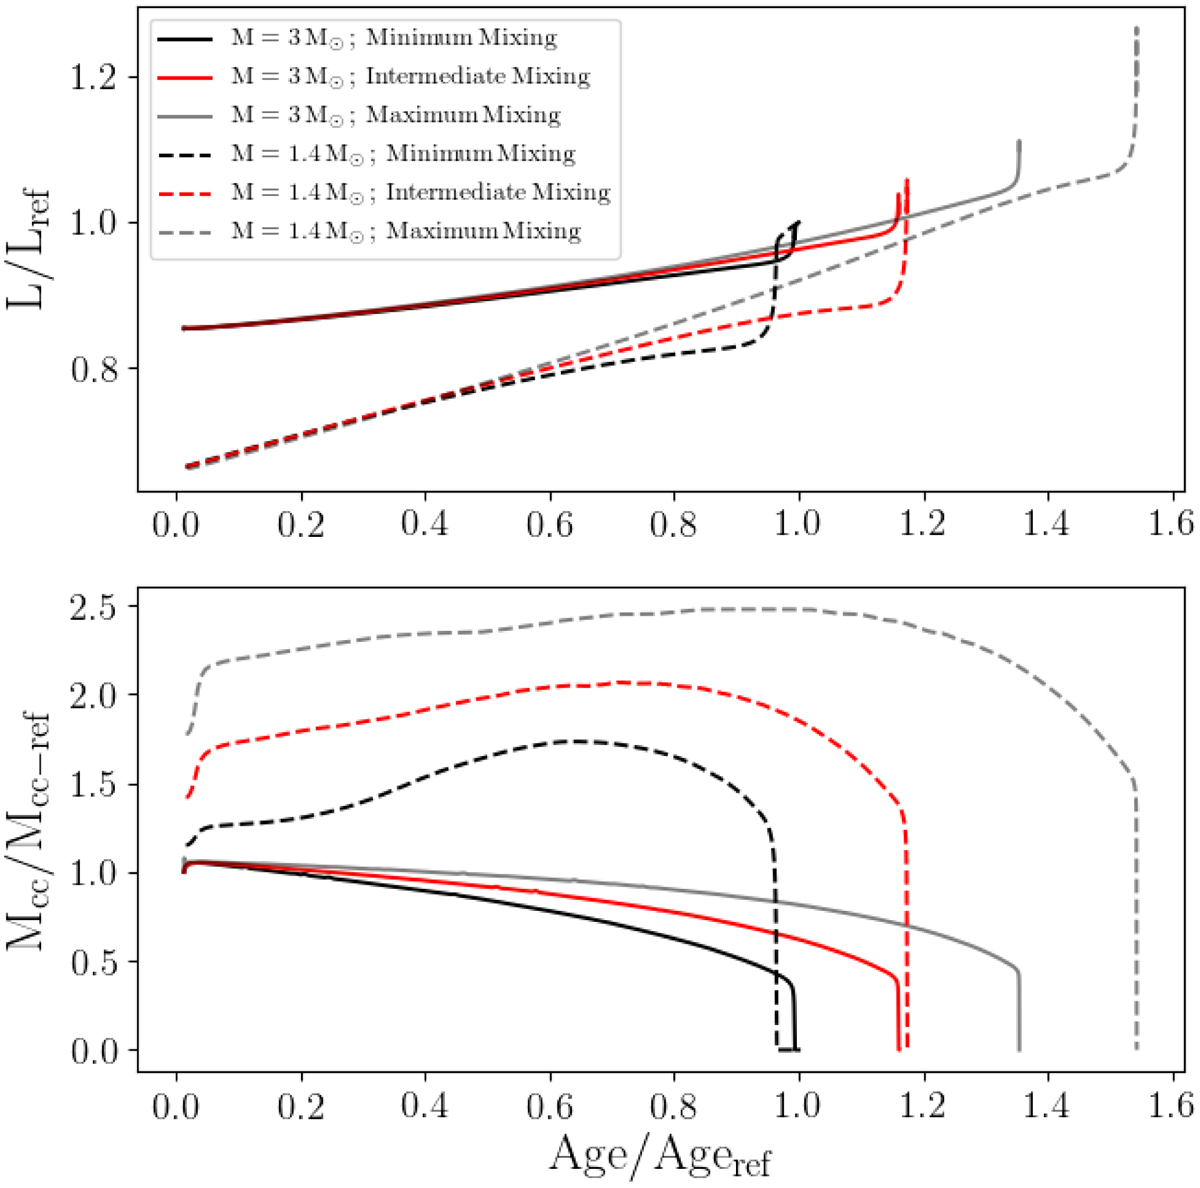
Comparitive plots of stellar quantities over time. Top: luminosity of evolutionary models with varied amounts of mixing with reference to the luminosity and age of the model with the minimum amount of mixing at the TAMS. Bottom: convective core mass of evolutionary models with varied amounts of mixing with reference to the age of the model with the minimum amount of mixing at the TAMS and the core mass of the same model at the ZAMS.
Current usage metrics show cumulative count of Article Views (full-text article views including HTML views, PDF and ePub downloads, according to the available data) and Abstracts Views on Vision4Press platform.
Data correspond to usage on the plateform after 2015. The current usage metrics is available 48-96 hours after online publication and is updated daily on week days.
Initial download of the metrics may take a while.