Fig. 1.
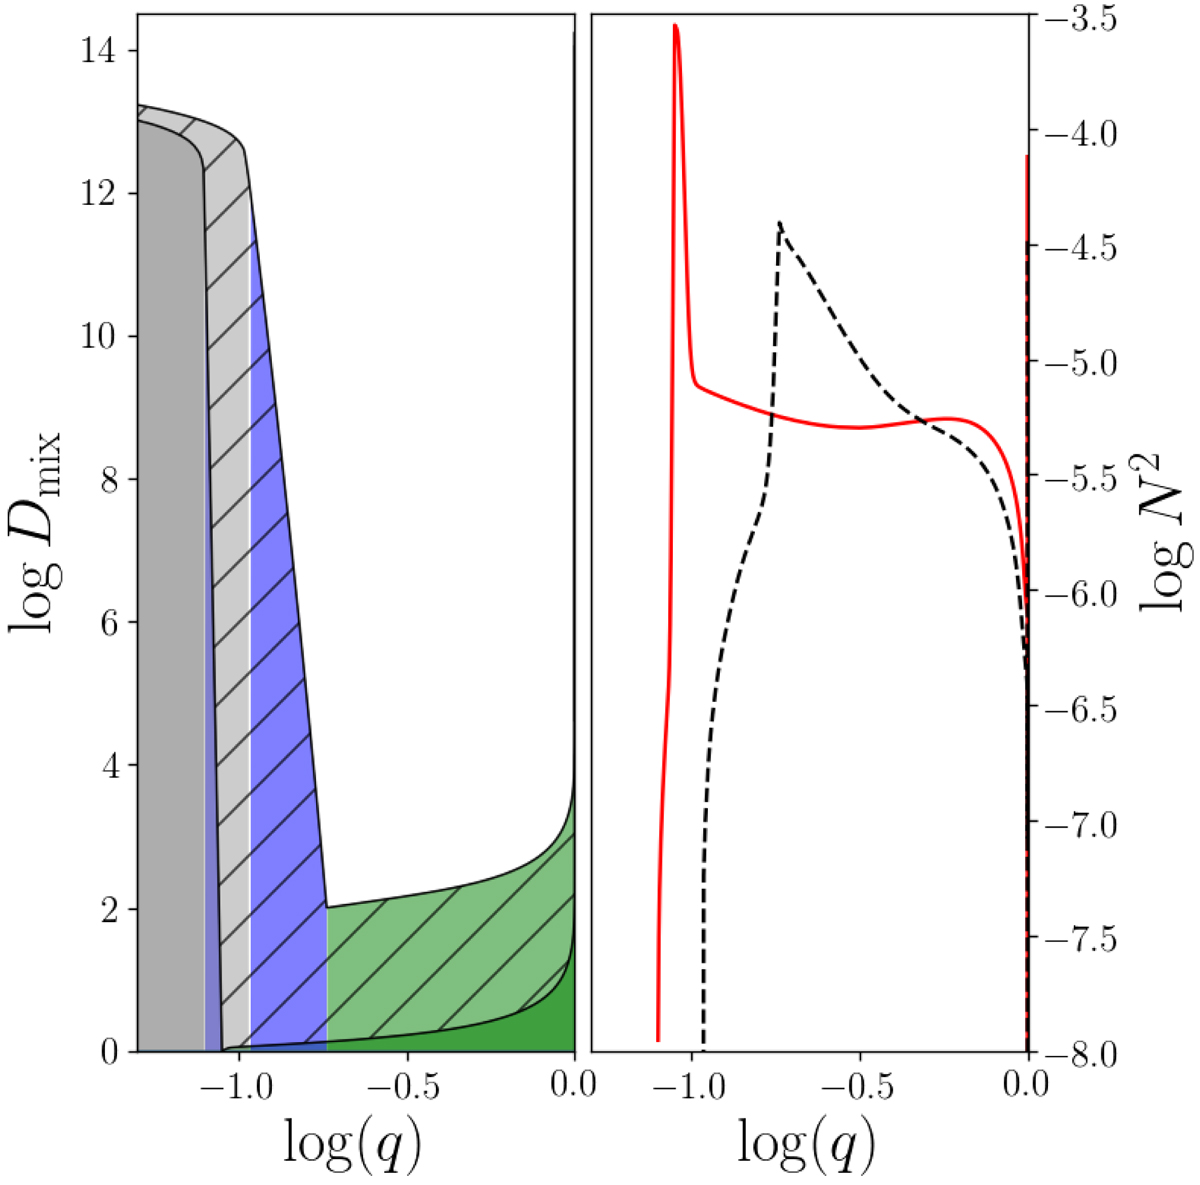
Comparative plots of stellar model interiors. Left: mixing profiles for two stellar models of 3 M⊙ and Xc = 0.3 for the convective core (grey), convective boundary region (CBM, blue) and radiative envelope region (REM, green) plotted against the logarithm of the mass coordinate q = m/M⋆. The model with mixing profiles indicated as hatched regions has eight times higher CBM and 100 times higher REM than the other model, leading to an increase in core mass of 36.5%. Right: logarithm of N2 of the two models plotted against the logarithm of the mass coordinate q. The solid red line denotes N2 of the model with a minimum amount of interior mixing, while the dashed black line denotes N2 of the model with eight times higher CBM and 100 times higher REM.
Current usage metrics show cumulative count of Article Views (full-text article views including HTML views, PDF and ePub downloads, according to the available data) and Abstracts Views on Vision4Press platform.
Data correspond to usage on the plateform after 2015. The current usage metrics is available 48-96 hours after online publication and is updated daily on week days.
Initial download of the metrics may take a while.