Fig. 2.
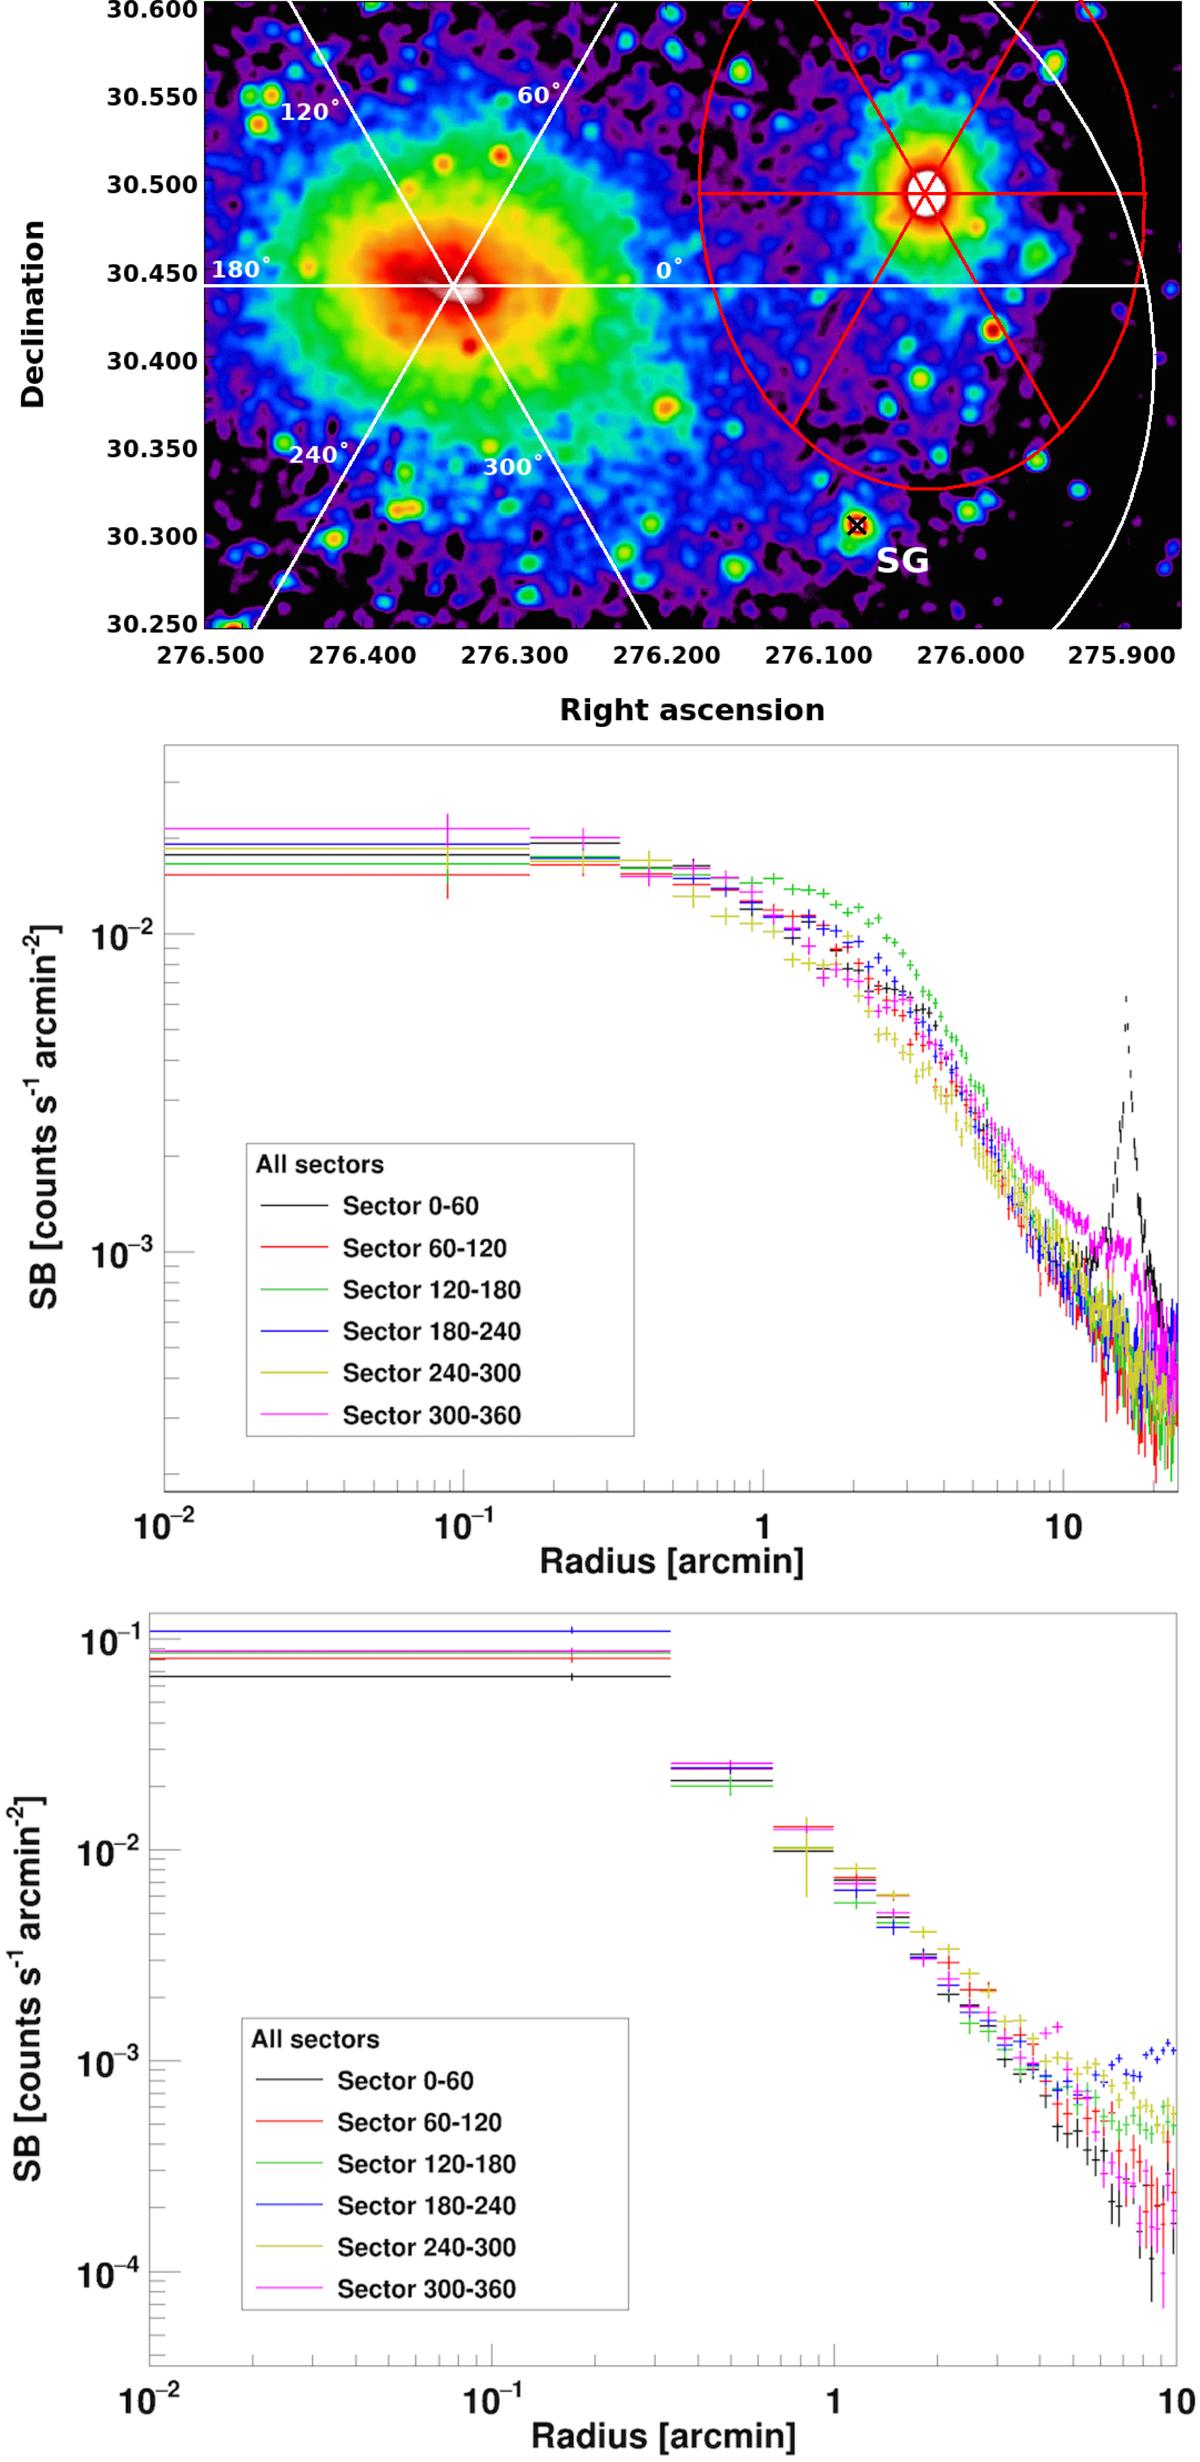
Top panel: elliptical sectors (60° wide) used for the extraction of surface brightness profiles, overplotted on the XMM-Newton mosaic image (Fig. 1). The orientation angle is calculated counterclockwise from the Right Ascension axis. Middle and bottom panels: elliptical surface brightness profiles of RXCJ1825 and CIZAJ1824 extracted in the sectors, respectively. In the x-axis we plot the distances along the major axis of the ellipses. Point-like sources are removed. The black cross shows the position of the SG. The features seen in the profiles are described in Sect. 3.1.1.
Current usage metrics show cumulative count of Article Views (full-text article views including HTML views, PDF and ePub downloads, according to the available data) and Abstracts Views on Vision4Press platform.
Data correspond to usage on the plateform after 2015. The current usage metrics is available 48-96 hours after online publication and is updated daily on week days.
Initial download of the metrics may take a while.