Free Access
Fig. 1.
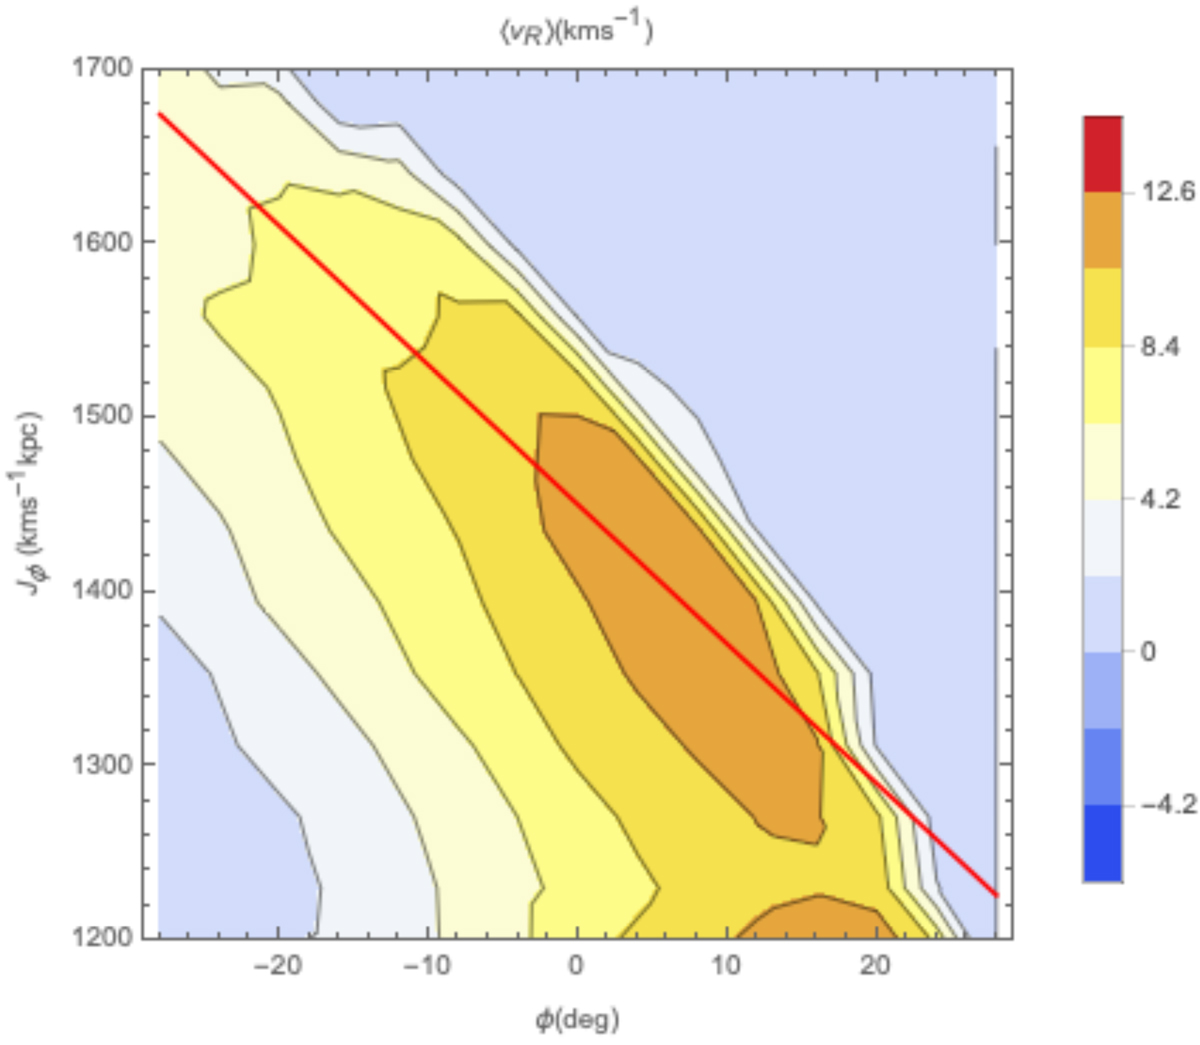
Mean vR in the (ϕ, Jϕ) space obtained from DFs computed on velocity grids (Δv = 10 km s−1) at R = R0 and different ϕ at a distance Δϕ = 4°, using the Portail et al. (2017) model and the method described in Monari et al. (2017c) and M19 (see Sect. 2 for details). The red line corresponds to a slope of −8 km s−1 deg−1.
Current usage metrics show cumulative count of Article Views (full-text article views including HTML views, PDF and ePub downloads, according to the available data) and Abstracts Views on Vision4Press platform.
Data correspond to usage on the plateform after 2015. The current usage metrics is available 48-96 hours after online publication and is updated daily on week days.
Initial download of the metrics may take a while.