Fig. 12.
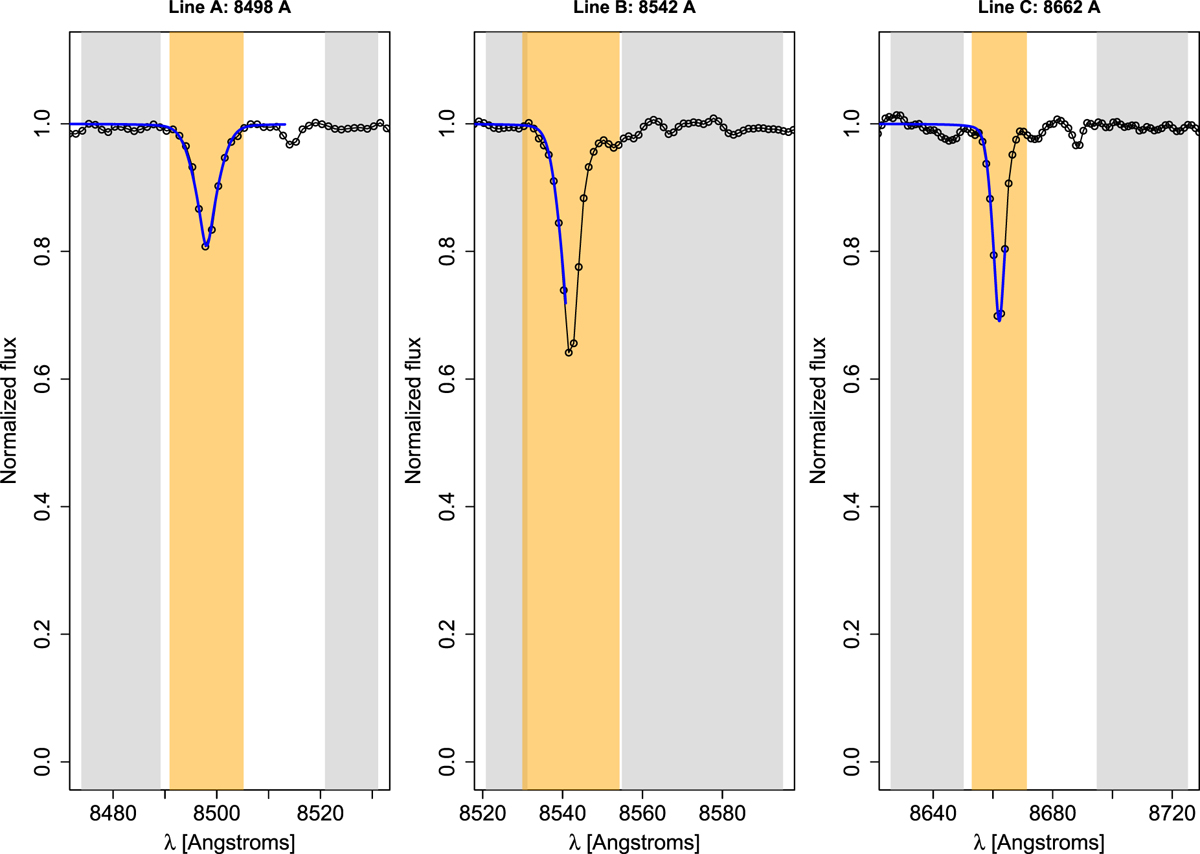
Fit to CaT lines A: 8498 Å; B: 8542 Å, and C: 8662 Å for star 1378 as example. The shaded gray areas show the local continuum regions and the shaded orange areas show the line region defined by Vásquez et al. (2015). The black lines and dots trace the observed spectrum in the rest frame and the blue lines are the best model fit to the data, using a sum of Gaussian and Lorentzian functions. The spectrum has been locally normalized using the highlighted local continuum regions before the fitting. In this analysis we only use the sum of the equivalent widths of the two strongest lines (B+C) following the recipe of Vásquez et al. (2015, 2018).
Current usage metrics show cumulative count of Article Views (full-text article views including HTML views, PDF and ePub downloads, according to the available data) and Abstracts Views on Vision4Press platform.
Data correspond to usage on the plateform after 2015. The current usage metrics is available 48-96 hours after online publication and is updated daily on week days.
Initial download of the metrics may take a while.