Fig. 7.
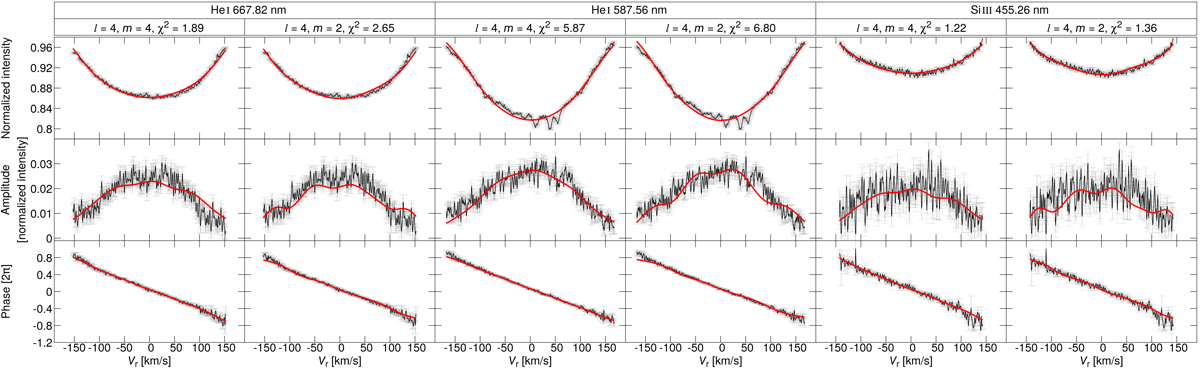
Results of the FPF fits of f1 to He I 667.82 nm, He I 587.56 nm, and Si III 455.26 nm spectral lines of NGC 6910-14. Top panels: line profiles, middle panels amplitudes, and bottom panels: phases. Observed profiles, amplitudes, and phases are plotted with black lines, their errors are marked with grey bars, and model fits are plotted with red lines. The profile of the He I 587.56 nm line near the core is disturbed by telluric lines.
Current usage metrics show cumulative count of Article Views (full-text article views including HTML views, PDF and ePub downloads, according to the available data) and Abstracts Views on Vision4Press platform.
Data correspond to usage on the plateform after 2015. The current usage metrics is available 48-96 hours after online publication and is updated daily on week days.
Initial download of the metrics may take a while.