Free Access
Fig. 2.
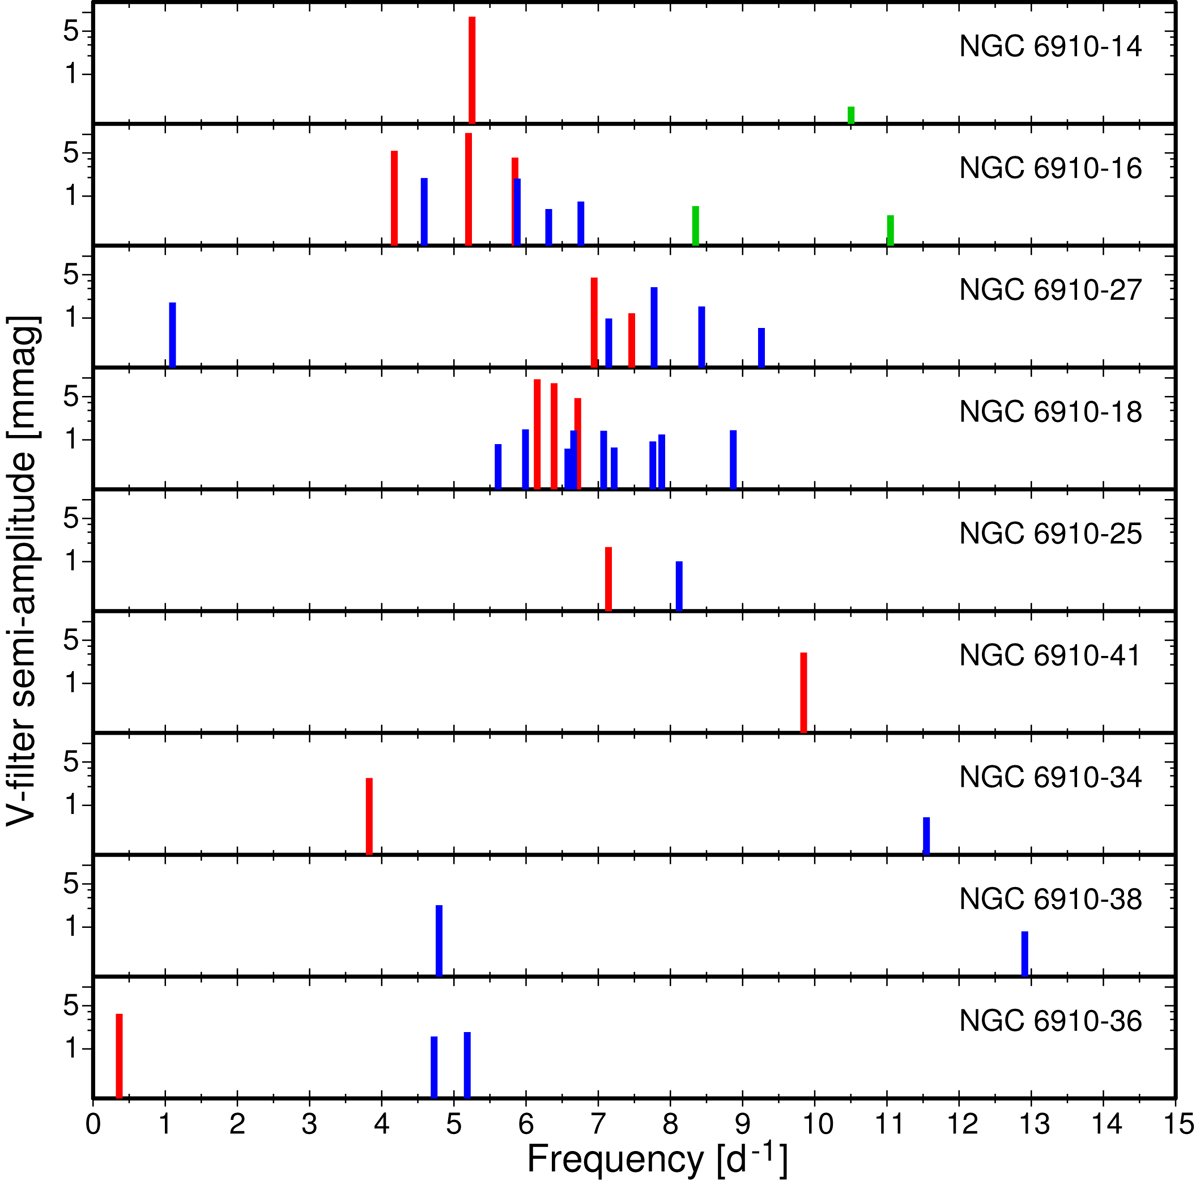
Schematic frequency spectra of the nine program stars. The intrinsic modes are shown as red lines, if detected both in the 2005–2007 and 2013 V-filter data, or blue lines, if detected only in the 2005–2007 data. Detected harmonics and combination frequencies are shown with green lines.
Current usage metrics show cumulative count of Article Views (full-text article views including HTML views, PDF and ePub downloads, according to the available data) and Abstracts Views on Vision4Press platform.
Data correspond to usage on the plateform after 2015. The current usage metrics is available 48-96 hours after online publication and is updated daily on week days.
Initial download of the metrics may take a while.