Fig. 16.
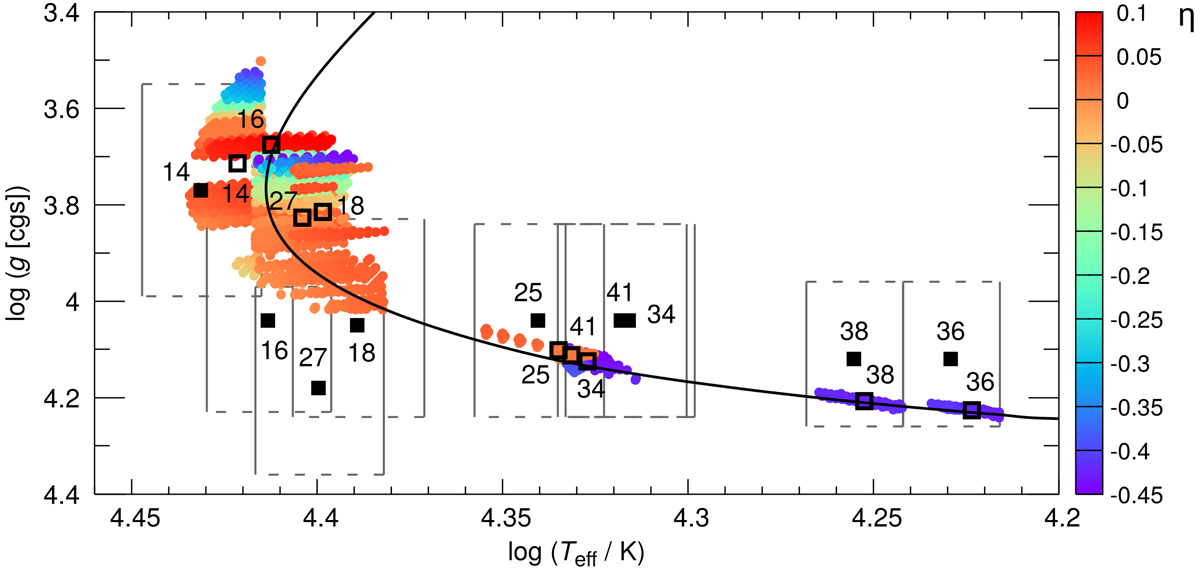
Joint Kiel diagram for nine program stars in NGC 6910. Only models comprising the five criteria defined at the beginning of Sect. 5.4 are plotted as colour dots, with the colour corresponding to the value of η (right side bar). The filled and open squares denote the positions of the program stars according to the adopted parameters from Table 2 and to the final determination from the EnsA (Table 4), respectively. The black line is the 10.6 Myr isochrone calculated for Veq = 170 km s−1 and αov = 0.2.
Current usage metrics show cumulative count of Article Views (full-text article views including HTML views, PDF and ePub downloads, according to the available data) and Abstracts Views on Vision4Press platform.
Data correspond to usage on the plateform after 2015. The current usage metrics is available 48-96 hours after online publication and is updated daily on week days.
Initial download of the metrics may take a while.