Fig. 14.
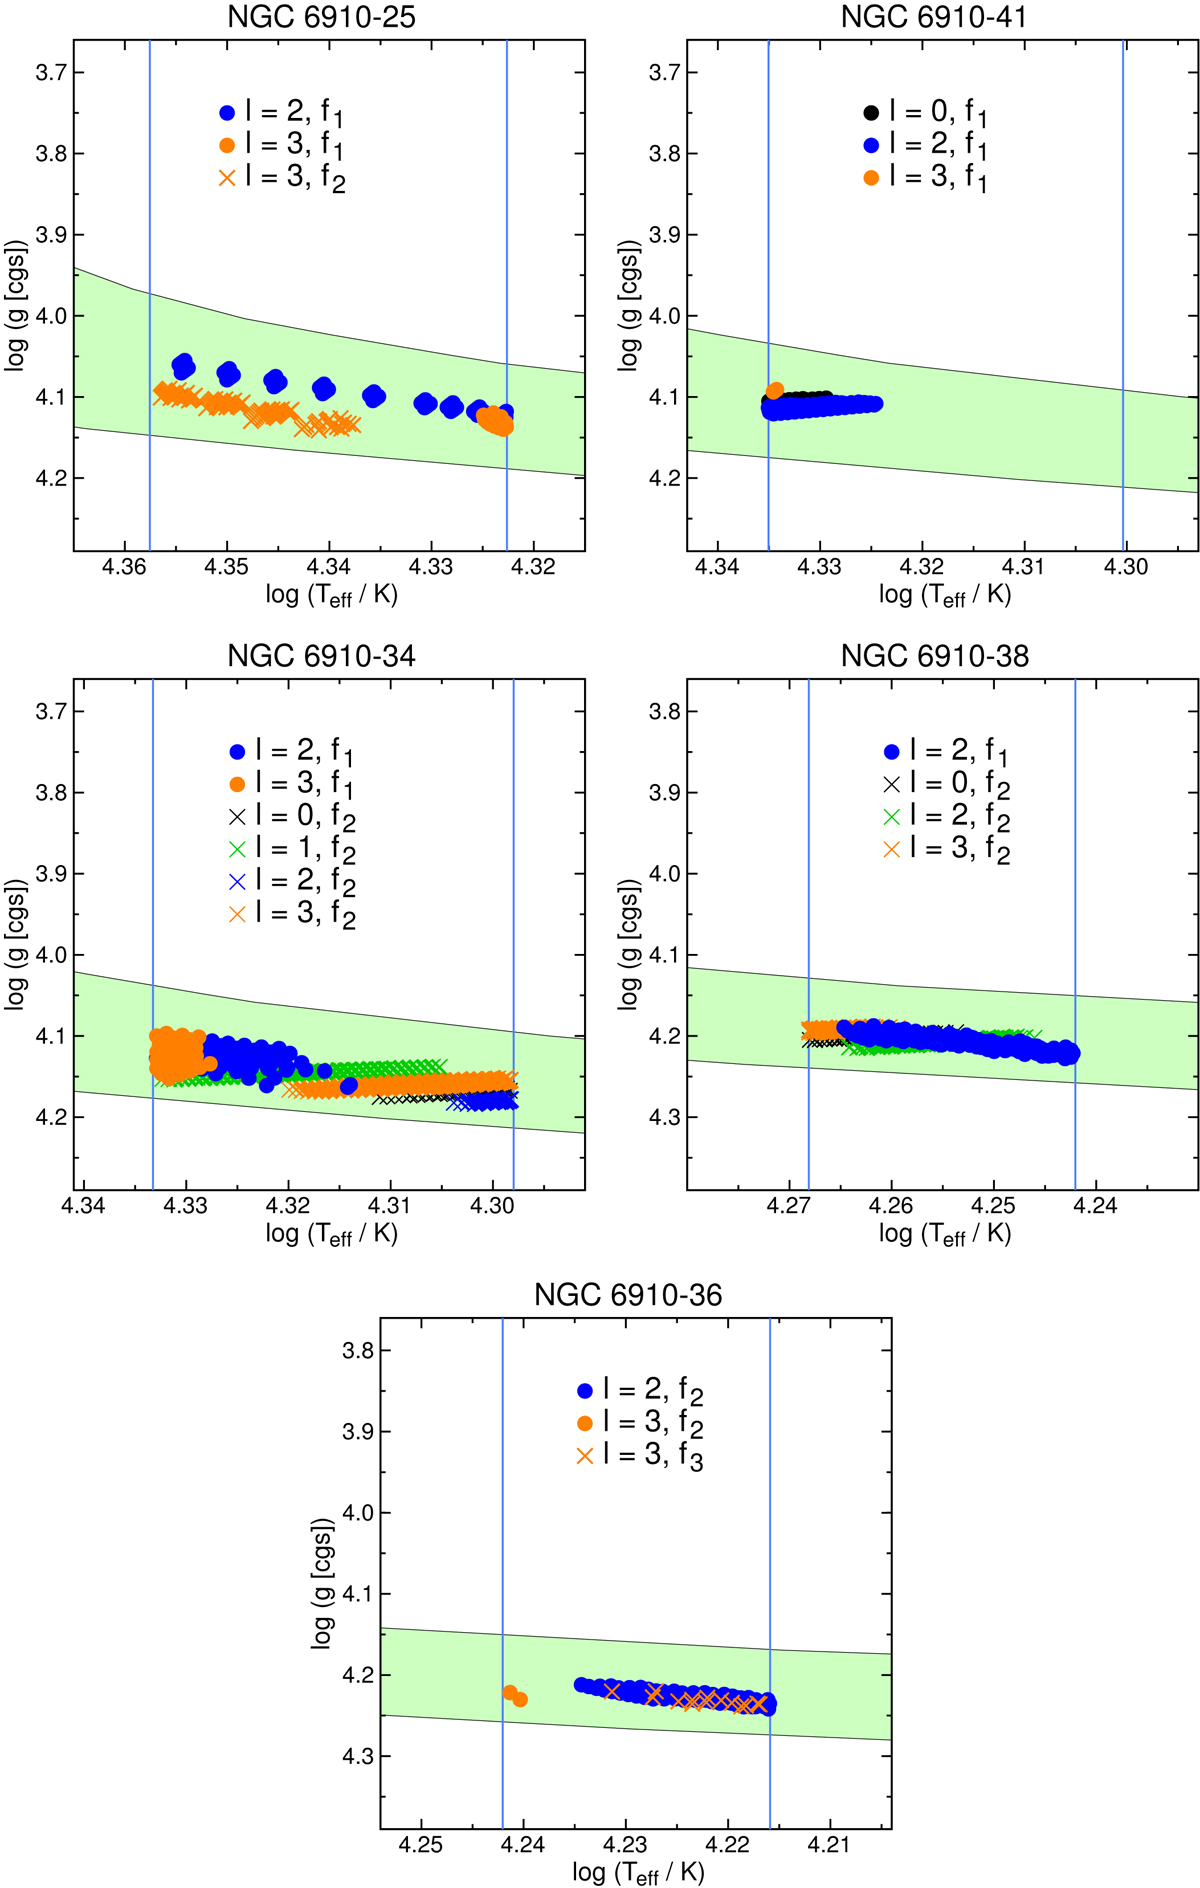
Kiel diagrams for models of NGC 6910-25, 41, 34, 38, and 36. The green area is the same as in Fig. 11. Blue vertical lines correspond to the adopted Teff limits from Table 2. For these program stars, pulsational models for only a single rotational velocity Veq = 170 km s−1 were considered. Symbols represent models that reproduce the labelled frequencies for a given l.
Current usage metrics show cumulative count of Article Views (full-text article views including HTML views, PDF and ePub downloads, according to the available data) and Abstracts Views on Vision4Press platform.
Data correspond to usage on the plateform after 2015. The current usage metrics is available 48-96 hours after online publication and is updated daily on week days.
Initial download of the metrics may take a while.