Fig. 13.
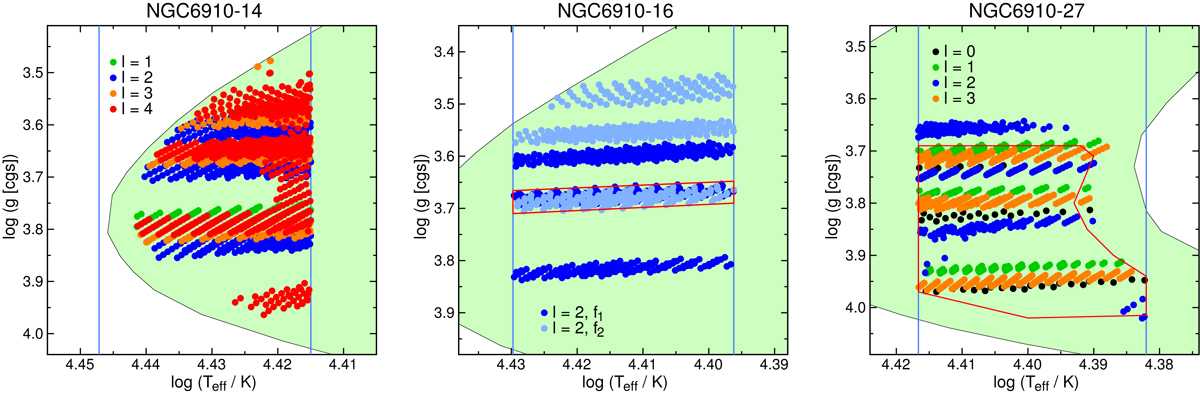
Kiel diagrams for models of NGC 6910-14 (left), 16 (middle), and 27 (right). The green area is the same as in Fig. 11. Blue vertical lines correspond to the adopted Teff limits from Table 2. For these program stars, pulsational models for only a single rotational velocity Veq = 170 km s−1 were considered. Symbols with different colours in left and right panels correspond to different l (labelled). For NGC 6910-16 (middle panel), dots represent models for which two observed frequencies, f1 (dark blue) and f2 (light blue), are reproduced as l = 2 modes. The red line delimits the area common to models that reproduce both these modes. For NGC 6910-27 (right panel), dots represent models for which the frequency f1 is reproduced. For clarity, models reproducing f2 are not shown. Instead, the area common to models reproducing both f1 and f2 is enclosed with a red line.
Current usage metrics show cumulative count of Article Views (full-text article views including HTML views, PDF and ePub downloads, according to the available data) and Abstracts Views on Vision4Press platform.
Data correspond to usage on the plateform after 2015. The current usage metrics is available 48-96 hours after online publication and is updated daily on week days.
Initial download of the metrics may take a while.