Fig. 11.
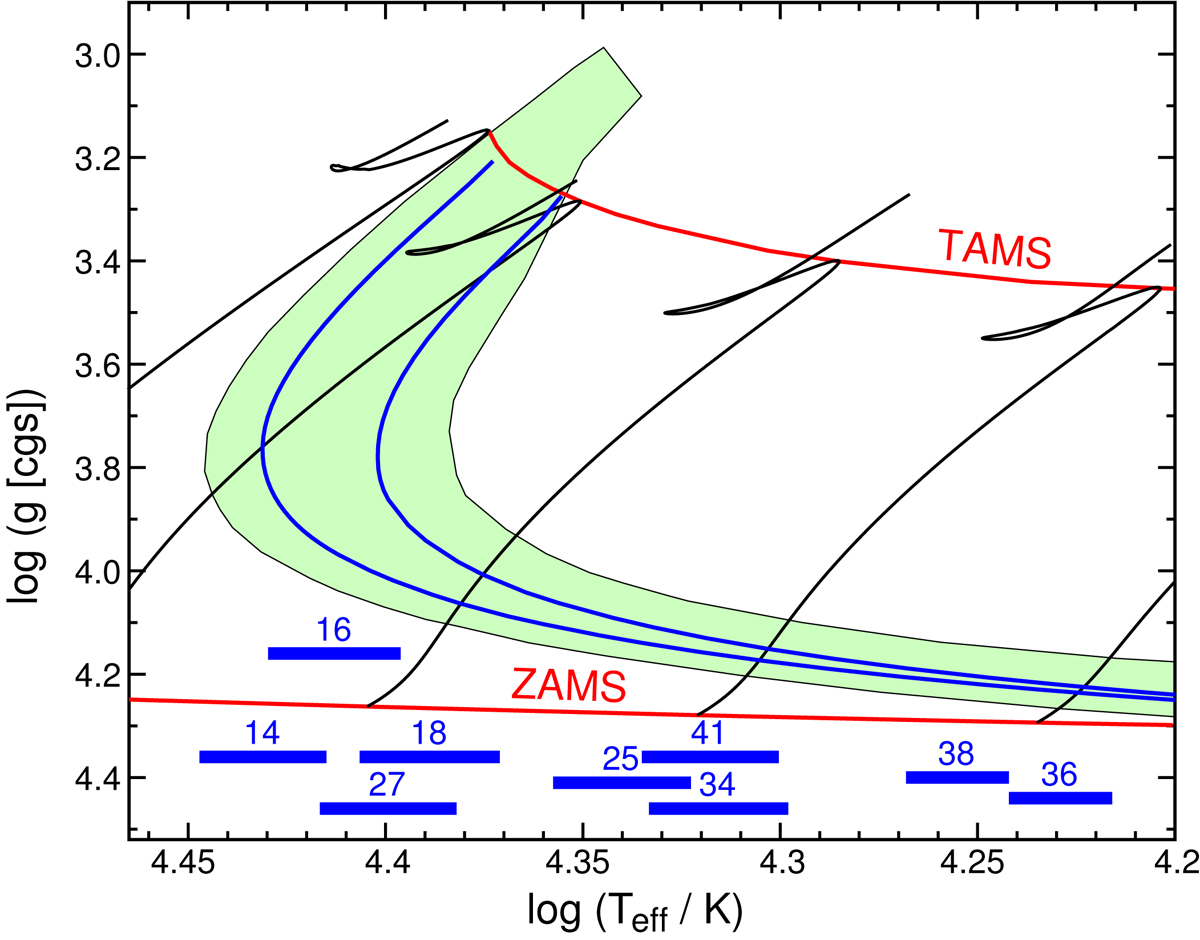
Kiel diagram for models of program stars in NGC 6910. The green area limits the location of models with ages between 9.25 and 11.61 Myr in the core hydrogen-burning phase (main sequence) with 0.0 < αov < 0.4 and 97 km s−1 < V sin i < 250 km s−1. The red lines stand for the ZAMS and TAMS phase. Black lines are evolutionary tracks for 5, 7, 10, 15, and 20 M⊙. Blue lines are isochrones for 9.25 and 11.61 Myr. Evolutionary tracks and isochrones are shown for Veq = 170 km s−1 and αov = 0.2. For each program star (labelled with number) the adopted range of Teff (Table 2) is marked by a blue bar in the lower part of the plot.
Current usage metrics show cumulative count of Article Views (full-text article views including HTML views, PDF and ePub downloads, according to the available data) and Abstracts Views on Vision4Press platform.
Data correspond to usage on the plateform after 2015. The current usage metrics is available 48-96 hours after online publication and is updated daily on week days.
Initial download of the metrics may take a while.