Fig. 4.
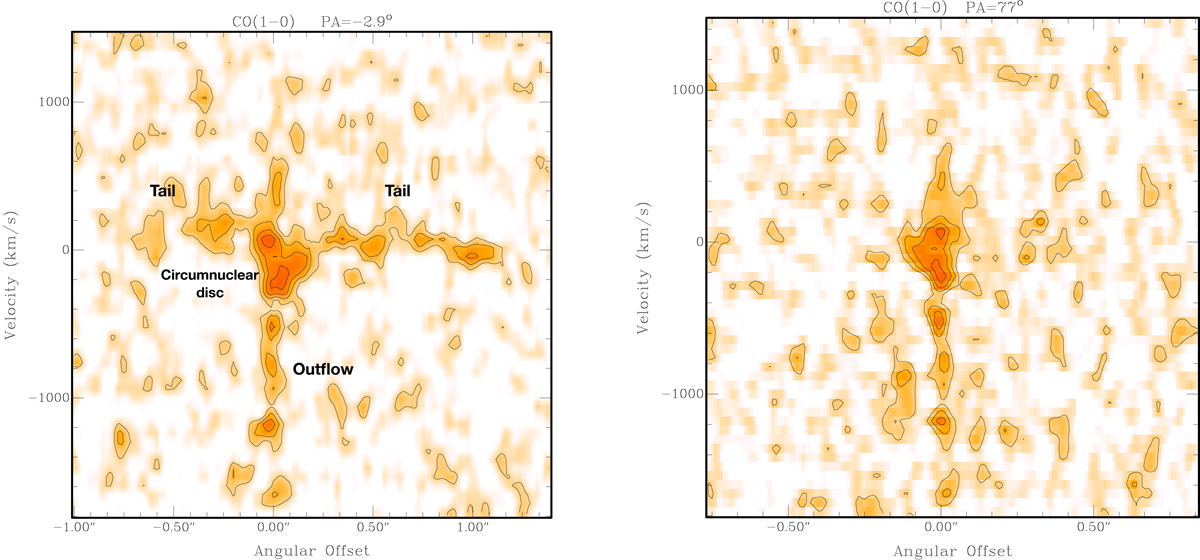
Left: position–velocity plot of the CO(1−0) taken along ![]() , i.e. along the direction of the inner parts of tails and almost perpendicular to the radio jet. The data cube used has a resolution of 0
, i.e. along the direction of the inner parts of tails and almost perpendicular to the radio jet. The data cube used has a resolution of 0![]() 09 × 0
09 × 0![]() 055 and a velocity resolution of 120 km s−1. Negative position offsets are south of the core. Contour levels are 0.12 (1.5σ), 0.24, 0.36 and 0.48 mJy beam−1. Right: position–velocity plot of the CO(1−0) centred in the core in the direction of the radio jet (PA = 77°). negative offsets are E of the core. Contour levels are 0.12 (1.5σ), 0.24, 0.36 and 0.48 mJy beam−1.
055 and a velocity resolution of 120 km s−1. Negative position offsets are south of the core. Contour levels are 0.12 (1.5σ), 0.24, 0.36 and 0.48 mJy beam−1. Right: position–velocity plot of the CO(1−0) centred in the core in the direction of the radio jet (PA = 77°). negative offsets are E of the core. Contour levels are 0.12 (1.5σ), 0.24, 0.36 and 0.48 mJy beam−1.
Current usage metrics show cumulative count of Article Views (full-text article views including HTML views, PDF and ePub downloads, according to the available data) and Abstracts Views on Vision4Press platform.
Data correspond to usage on the plateform after 2015. The current usage metrics is available 48-96 hours after online publication and is updated daily on week days.
Initial download of the metrics may take a while.