Open Access
Fig. 7
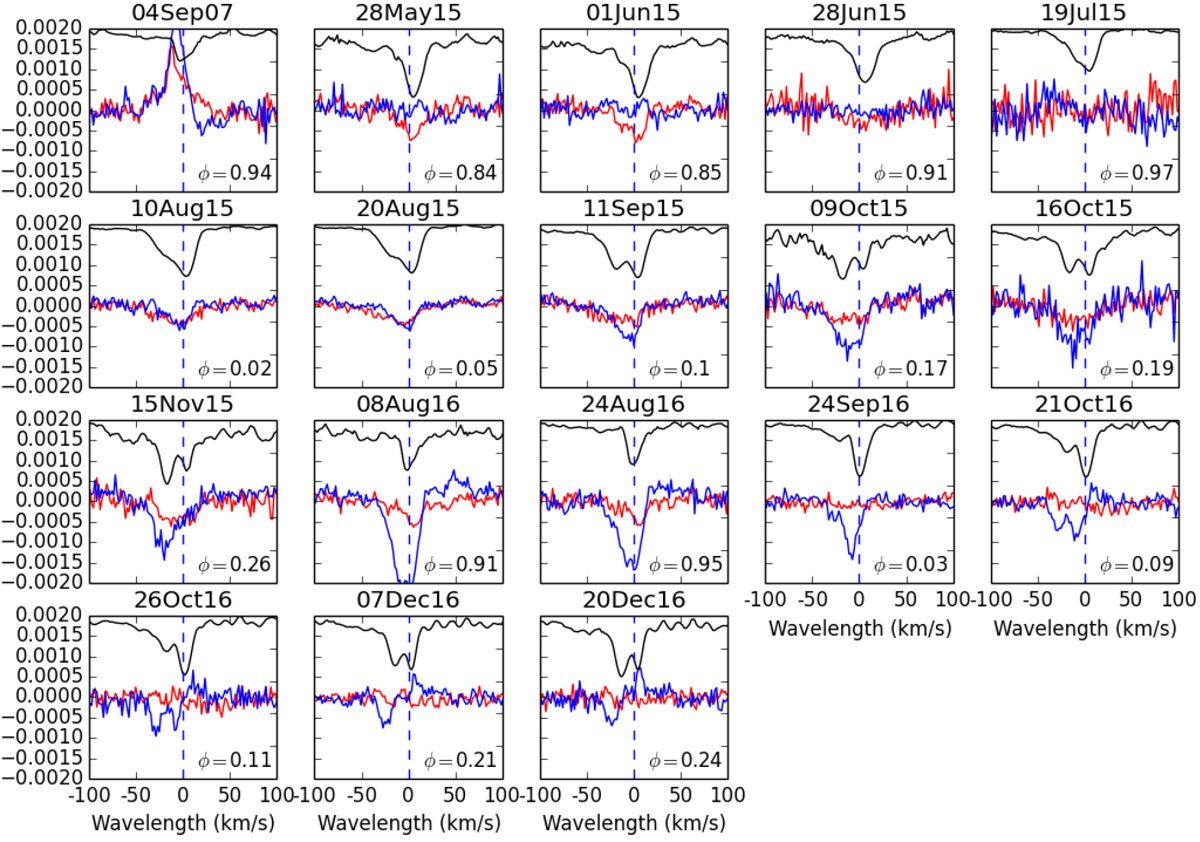
Spectra from LSD of χ Cyg for each one of the dates for which Stokes Q and U data are available. The vertical dashed line in each plot indicates the heliocentric zero wavelength. The inset text contains thephase at each observation.
Current usage metrics show cumulative count of Article Views (full-text article views including HTML views, PDF and ePub downloads, according to the available data) and Abstracts Views on Vision4Press platform.
Data correspond to usage on the plateform after 2015. The current usage metrics is available 48-96 hours after online publication and is updated daily on week days.
Initial download of the metrics may take a while.