Open Access
Fig. 6
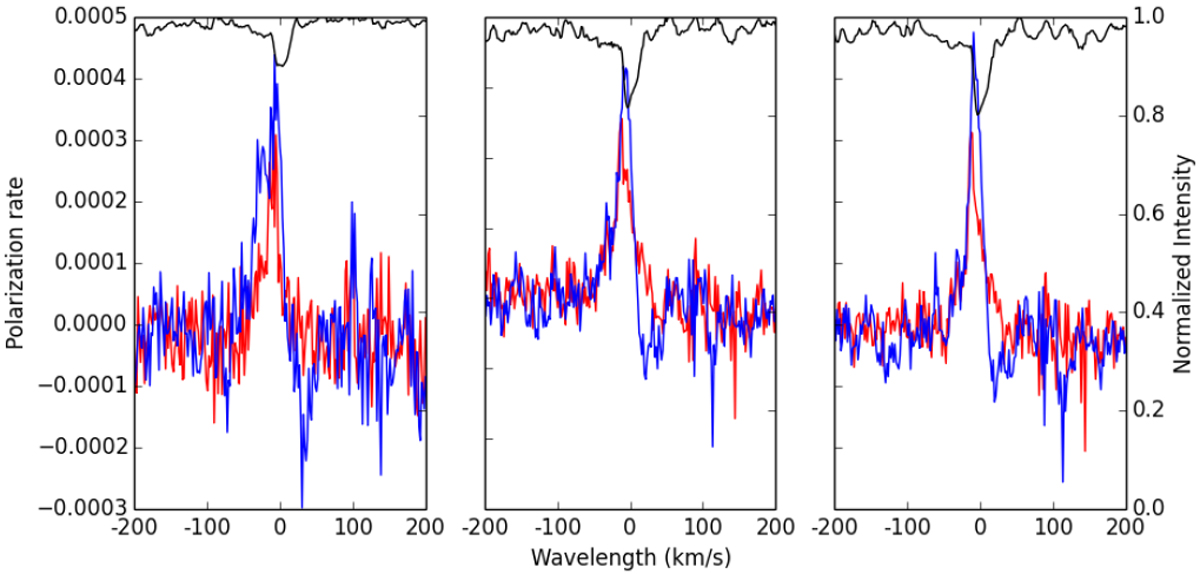
LSD Spectra of χ Cyg on September 4, 2007, with lines weighted by ![]() . Q is in red, U in blue. Three different masks are used from left to right: all lines deeper than 1%, all lines deeper than 40%, and a selection of lines deeper than 40% (see text).
. Q is in red, U in blue. Three different masks are used from left to right: all lines deeper than 1%, all lines deeper than 40%, and a selection of lines deeper than 40% (see text).
Current usage metrics show cumulative count of Article Views (full-text article views including HTML views, PDF and ePub downloads, according to the available data) and Abstracts Views on Vision4Press platform.
Data correspond to usage on the plateform after 2015. The current usage metrics is available 48-96 hours after online publication and is updated daily on week days.
Initial download of the metrics may take a while.