Fig. 4
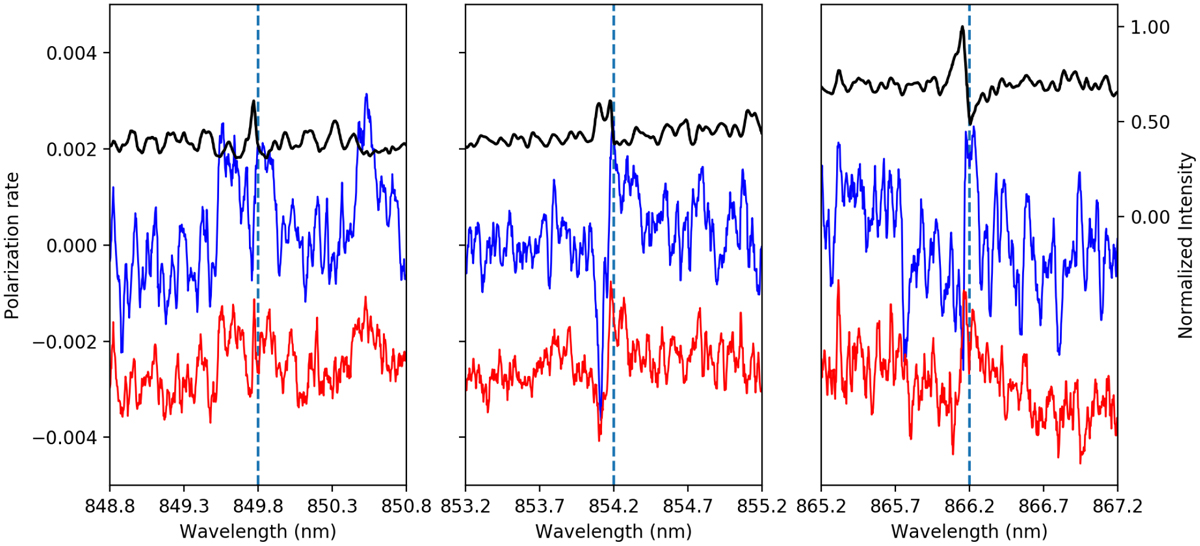
Spectra of χ Cyg on September 4, 2007 around the three lines of Ca II triplet in the near-infrared. As in Fig. 2, the black thin line represents intensity (ordinates at right) and Stokes Q and U are shown in red and blue, respectively. The quantity Q has been shifted 0.01 units for clarity. The lines are split into a blue-shifted emission and a red-shifted absorption. The polarisationchanges sign accordingly as if dominated by the amplification of anisotropy in the presence of velocity gradients.
Current usage metrics show cumulative count of Article Views (full-text article views including HTML views, PDF and ePub downloads, according to the available data) and Abstracts Views on Vision4Press platform.
Data correspond to usage on the plateform after 2015. The current usage metrics is available 48-96 hours after online publication and is updated daily on week days.
Initial download of the metrics may take a while.