Open Access
Fig. 3
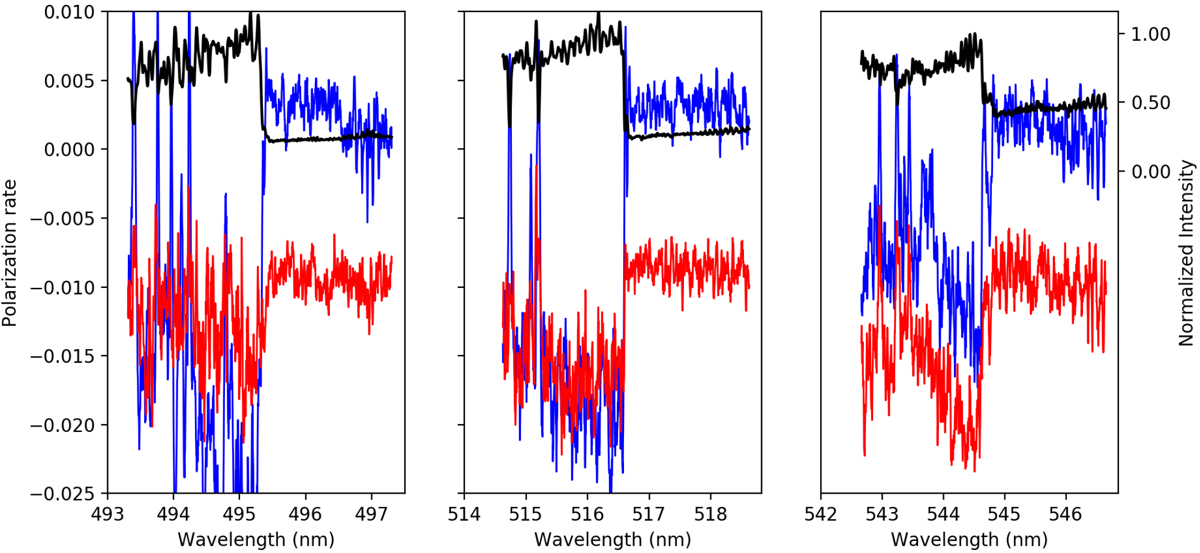
Spectra of χ Cyg on September 4, 2007 in three spectral regions in which molecular band heads of TiO and VO are found. As in Fig. 2, the black thin line represents intensity (ordinates at right) and Stokes Q and U are shown in red and blue, respectively. The Q profile has been shifted 0.01 units for clarity.
Current usage metrics show cumulative count of Article Views (full-text article views including HTML views, PDF and ePub downloads, according to the available data) and Abstracts Views on Vision4Press platform.
Data correspond to usage on the plateform after 2015. The current usage metrics is available 48-96 hours after online publication and is updated daily on week days.
Initial download of the metrics may take a while.