Fig. 2
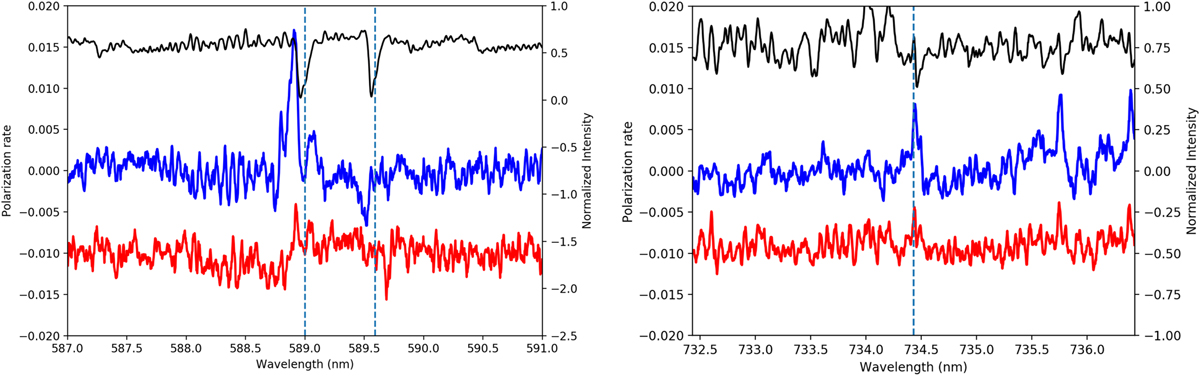
Spectra of χ Cyg on September 4, 2007. Left: around the region of the Na D doublet; right: around a Ti I line in the near-infrared spectrum. The thin black line shows the intensity (ordinate axis on the right) in normalised units, whereas the thick coloured lines (blue for U, red for Q) show the linear polarisation spectra. The rest wavelength of both Na D1 and D2 in the left plot and the Ti I line in the right plot are represented with a vertical dashed line.
Current usage metrics show cumulative count of Article Views (full-text article views including HTML views, PDF and ePub downloads, according to the available data) and Abstracts Views on Vision4Press platform.
Data correspond to usage on the plateform after 2015. The current usage metrics is available 48-96 hours after online publication and is updated daily on week days.
Initial download of the metrics may take a while.