Fig. 9.
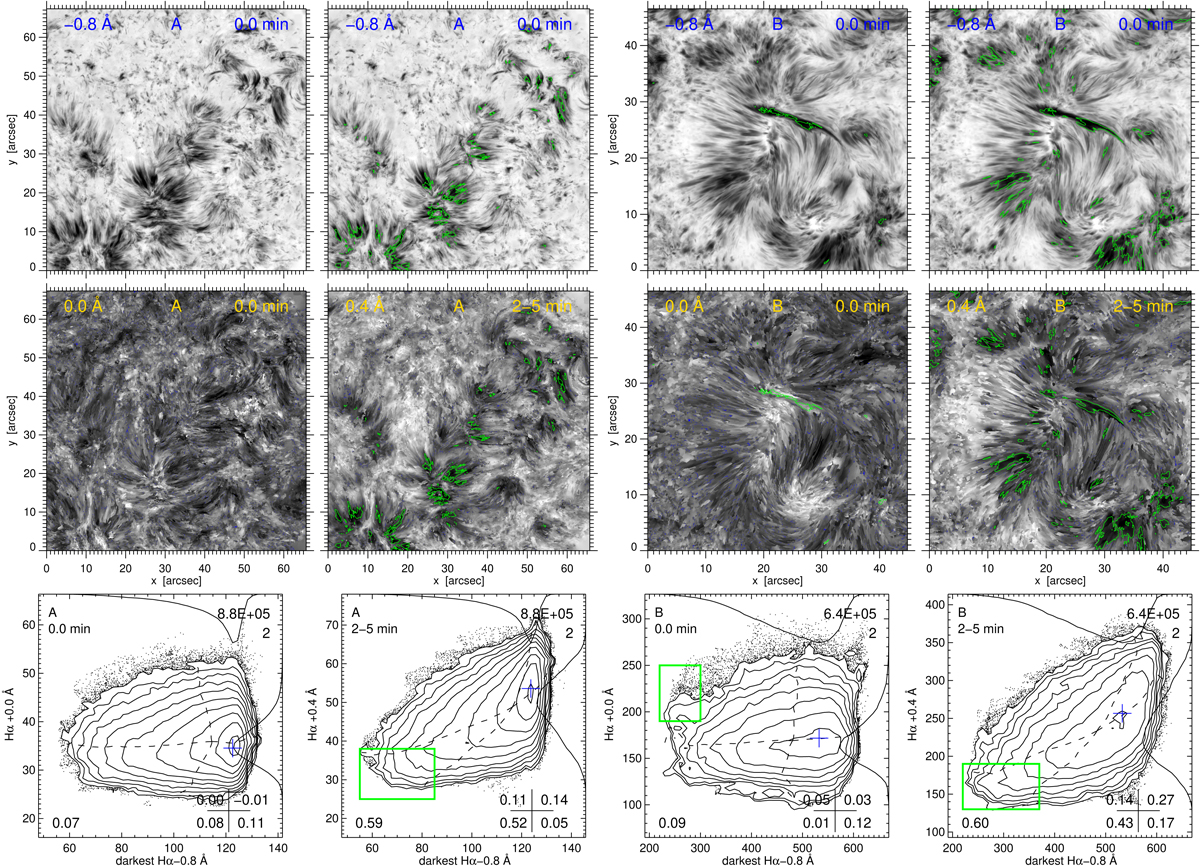
Time-delay scatter analysis for the darkest RBE moments in data A (left two columns) and data B (right two columns). First row: Hα images at Δλ = −0.8 Å constructed by selecting the darkest value for each pixel throughout the entire observation duration. The first pair of images is identical except for the green overlays; so is the second pair. Second row: simultaneous and delayed Hα line-core images. Third row: scatter diagrams for each image pair above it. First and third columns: data A and B image pairs with the lower image made up of the same pixels at Hα line center at the same sampling times. Second and fourth columns: data A and B image pairs with the lower image made up of the same pixels, but selecting the darkest value per pixel at Δλ = +0.4 Å during the 2 − 5 min delay range after the upper-image pixel sampling times. The green boxes select specific correlation features with corresponding contours in the image pairs. Online image blinkers: 1–5, 1–6, 3–7, 3–8.
Current usage metrics show cumulative count of Article Views (full-text article views including HTML views, PDF and ePub downloads, according to the available data) and Abstracts Views on Vision4Press platform.
Data correspond to usage on the plateform after 2015. The current usage metrics is available 48-96 hours after online publication and is updated daily on week days.
Initial download of the metrics may take a while.