Fig. 8.
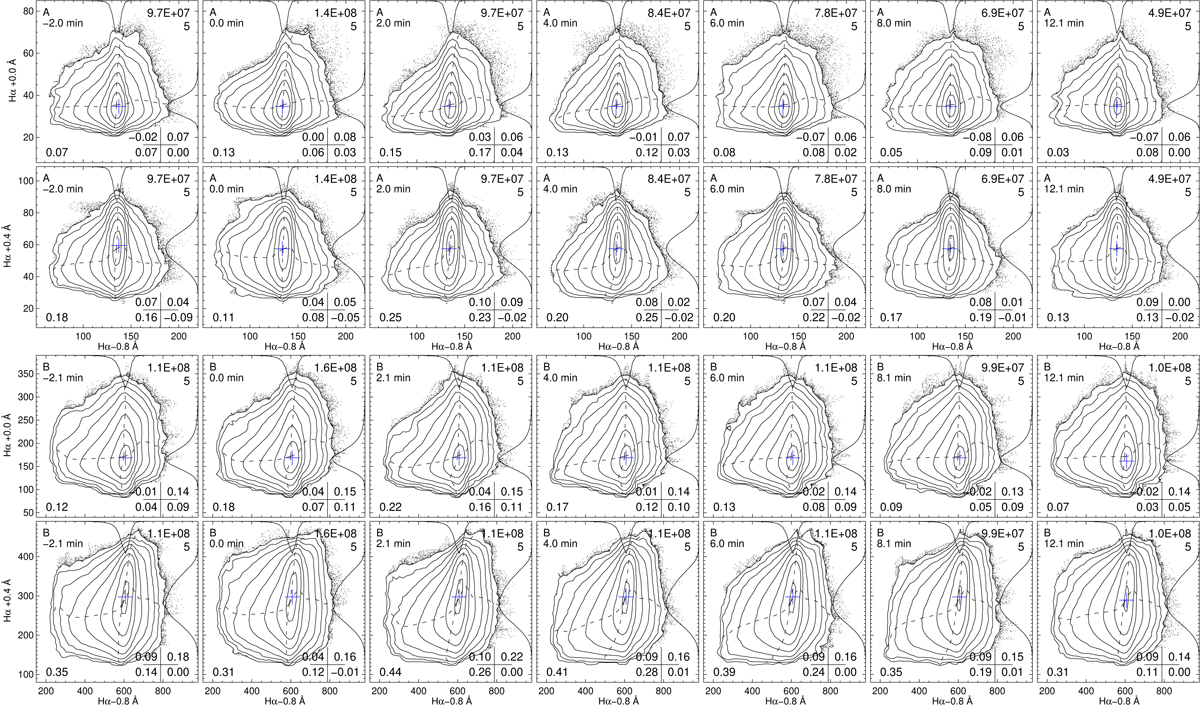
Full-sequence time-delay scatter analysis for data A (upper two rows) and data B (lower two rows). In each pair the upper row shows the pixel-by-pixel correlation for Hα line-center intensity before or after the Hα blue wing intensity at Δλ = −0.8 Å. Lower row: per pair shows the correlation of red-core intensity at Δλ = +0.4 Å with blue-wing intensity. The sampling delays (positive for the core after the blue wing) are specified at the upper left in each panel. The worst-seeing images are discarded (25% for data A, 33% for data B). Axes are the same as Figs. 6 and 7.
Current usage metrics show cumulative count of Article Views (full-text article views including HTML views, PDF and ePub downloads, according to the available data) and Abstracts Views on Vision4Press platform.
Data correspond to usage on the plateform after 2015. The current usage metrics is available 48-96 hours after online publication and is updated daily on week days.
Initial download of the metrics may take a while.