Fig. 7.
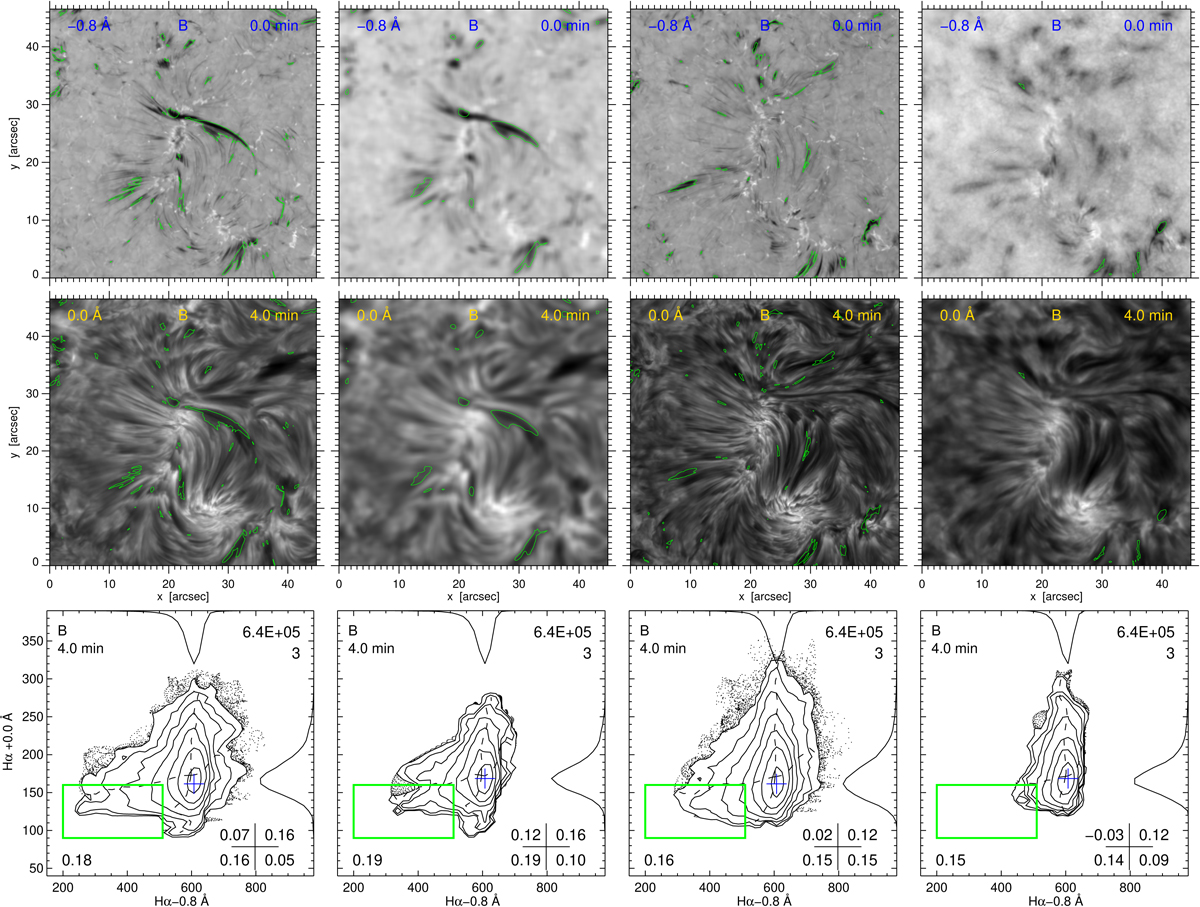
Time-delay scatter analysis at good and poor resolution in data B. First row: images in the blue wing of Hα at Δλ = −0.8 Å. Second row: images at Hα line-center taken 4 min later. Third row: scatter diagrams for each image pair above with the same axes as in Figs. 6 and 8. The green box selects the lower left part with corresponding pixels outlined by green contours in the images above. First column: image pair for the Pub B PHE and contrail, the same as in Fig. 1. Second column: same image pair smeared over 1 arcsec. Third column: image pair with good seeing. Fourth column: image pair with poor seeing. The latter pairs are marked with circles to the right in the lower graph of Fig. 2.
Current usage metrics show cumulative count of Article Views (full-text article views including HTML views, PDF and ePub downloads, according to the available data) and Abstracts Views on Vision4Press platform.
Data correspond to usage on the plateform after 2015. The current usage metrics is available 48-96 hours after online publication and is updated daily on week days.
Initial download of the metrics may take a while.