Free Access
Fig. 6.
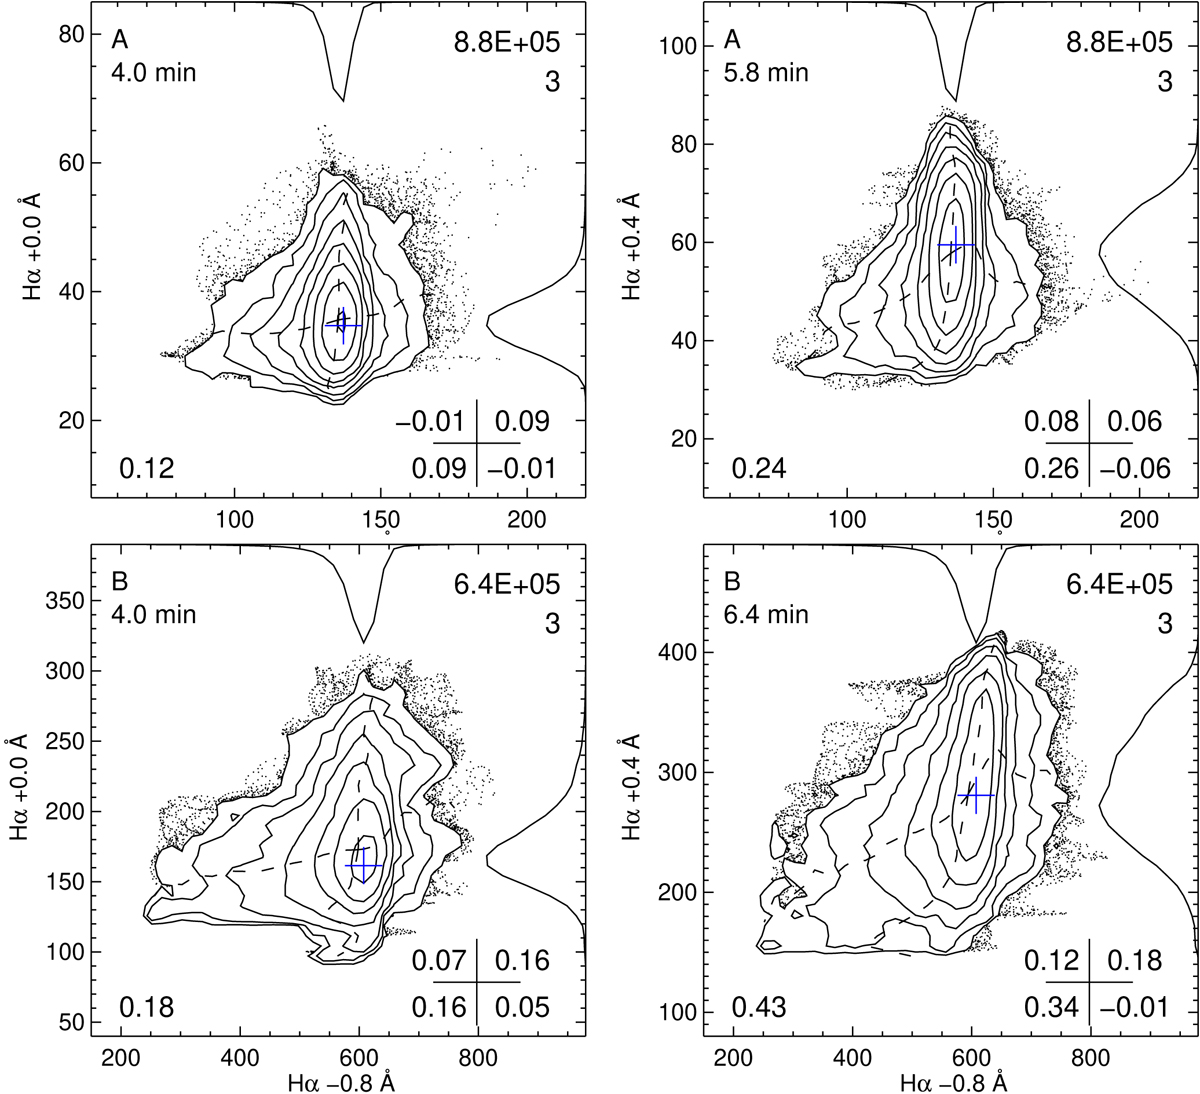
Scatter diagrams for the data A (upper row) and data B (lower row) image pairs in Fig. 1. Left column: intensity at the line center of Hα at 4 min time lag against intensity in the blue wing at Δλ = −0.8 Å 4 min. Right column: intensity at Δλ = +0.4 Å at about 6 min lag against intensity in the blue wing.
Current usage metrics show cumulative count of Article Views (full-text article views including HTML views, PDF and ePub downloads, according to the available data) and Abstracts Views on Vision4Press platform.
Data correspond to usage on the plateform after 2015. The current usage metrics is available 48-96 hours after online publication and is updated daily on week days.
Initial download of the metrics may take a while.