Fig. 5.
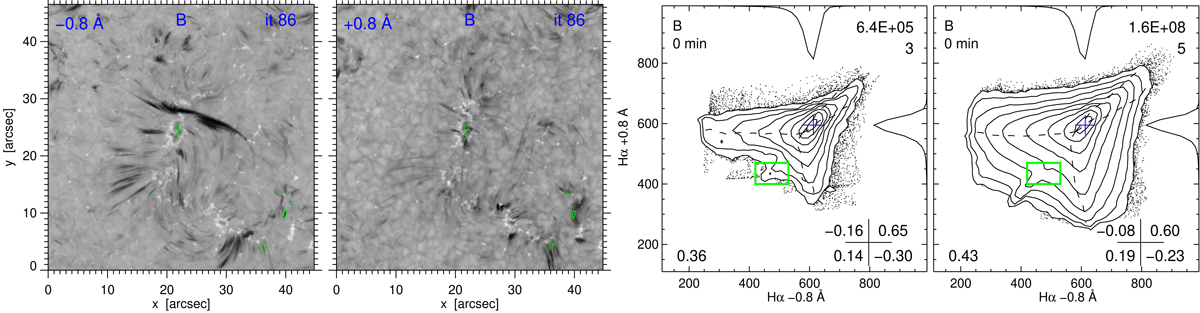
Strous-format scatter analysis for data B. Images: simultaneous blue- and red-wing images at Δλ = ±0.8 Å at the best-seeing moment (highest square in the lower graph of Fig. 2). First diagram: scatter contours for this image pair. The format is detailed in Sect. 2. The axis quantities are intensities in SST data units. The green box selects a specific low-density contour feature with the corresponding pixels outlined by green contours in the images. Second diagram: scatter contours for all such 252 image pairs in the data B sequence passing the seeing threshold, with the same axes and the green box repeated as location reference. Online image blinker: 1–2.
Current usage metrics show cumulative count of Article Views (full-text article views including HTML views, PDF and ePub downloads, according to the available data) and Abstracts Views on Vision4Press platform.
Data correspond to usage on the plateform after 2015. The current usage metrics is available 48-96 hours after online publication and is updated daily on week days.
Initial download of the metrics may take a while.