Fig. 4.
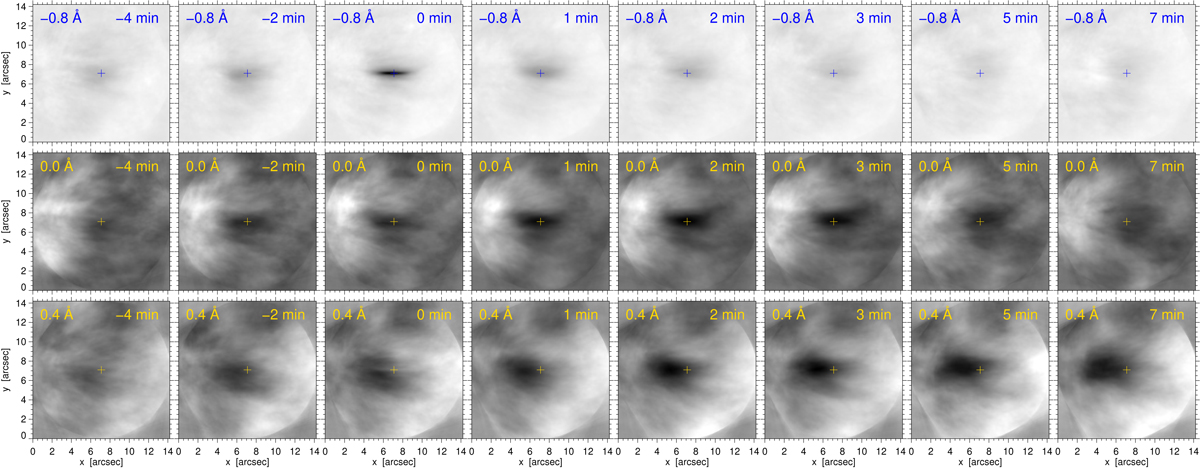
Stacked Hα image cutouts for data A. Before addition, all seeing-passed image cutouts are centered on the center of the RBE skeleton (plus) and rotated to point the skeleton to the right, away from the network to the left. Rows: averaged Hα samplings at Δλ = −0.8, 0.0 and 0.4 Å from mean line center. Columns: averaged samplings at different time delays with respect to each RBE track, from 4 min earlier sampling at the left to 7 min later sampling at the right. The Δλ and Δt values are specified at the top of each panel. The greyscales are shared along rows, defined by bytescaling the Δt = 0, 2, 3 min panels, respectively. Blank corners result from cutout rotations.
Current usage metrics show cumulative count of Article Views (full-text article views including HTML views, PDF and ePub downloads, according to the available data) and Abstracts Views on Vision4Press platform.
Data correspond to usage on the plateform after 2015. The current usage metrics is available 48-96 hours after online publication and is updated daily on week days.
Initial download of the metrics may take a while.