Fig. 16.
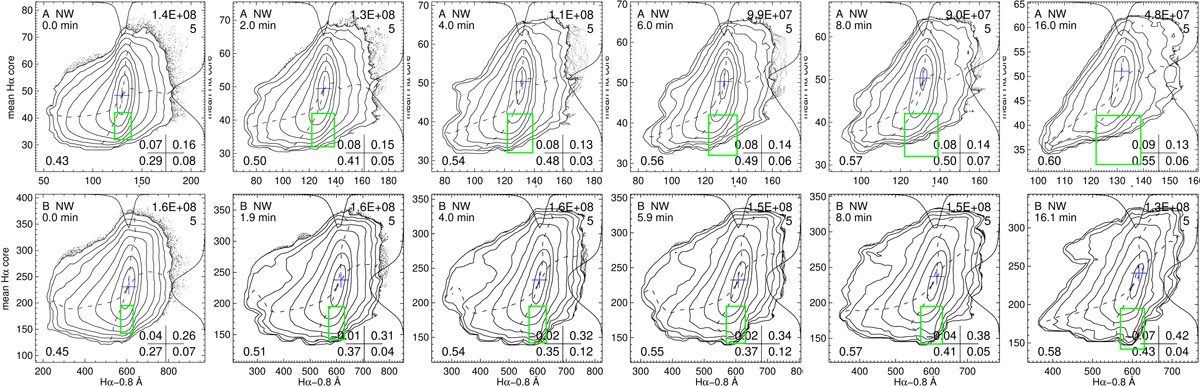
Full-sequence scatter analysis for data A (upper row) and data B lower row). Format as in Fig. 8, but only for the network areas and with temporal boxcar averaging over the duration specified at the top left in each panel. The poor-seeing moments are discarded, as specified in Fig. 2. Abscissas: Hα wing intensity at Δλ = −0.8 Å. Ordinates: Hα core intensity averaged over Δλ = [ − 0.4, +0.4] Å. The axes shrink along rows because momentary extremes lose weight. The green boxes outline the same ranges as in Fig. 15.
Current usage metrics show cumulative count of Article Views (full-text article views including HTML views, PDF and ePub downloads, according to the available data) and Abstracts Views on Vision4Press platform.
Data correspond to usage on the plateform after 2015. The current usage metrics is available 48-96 hours after online publication and is updated daily on week days.
Initial download of the metrics may take a while.