Fig. 15.
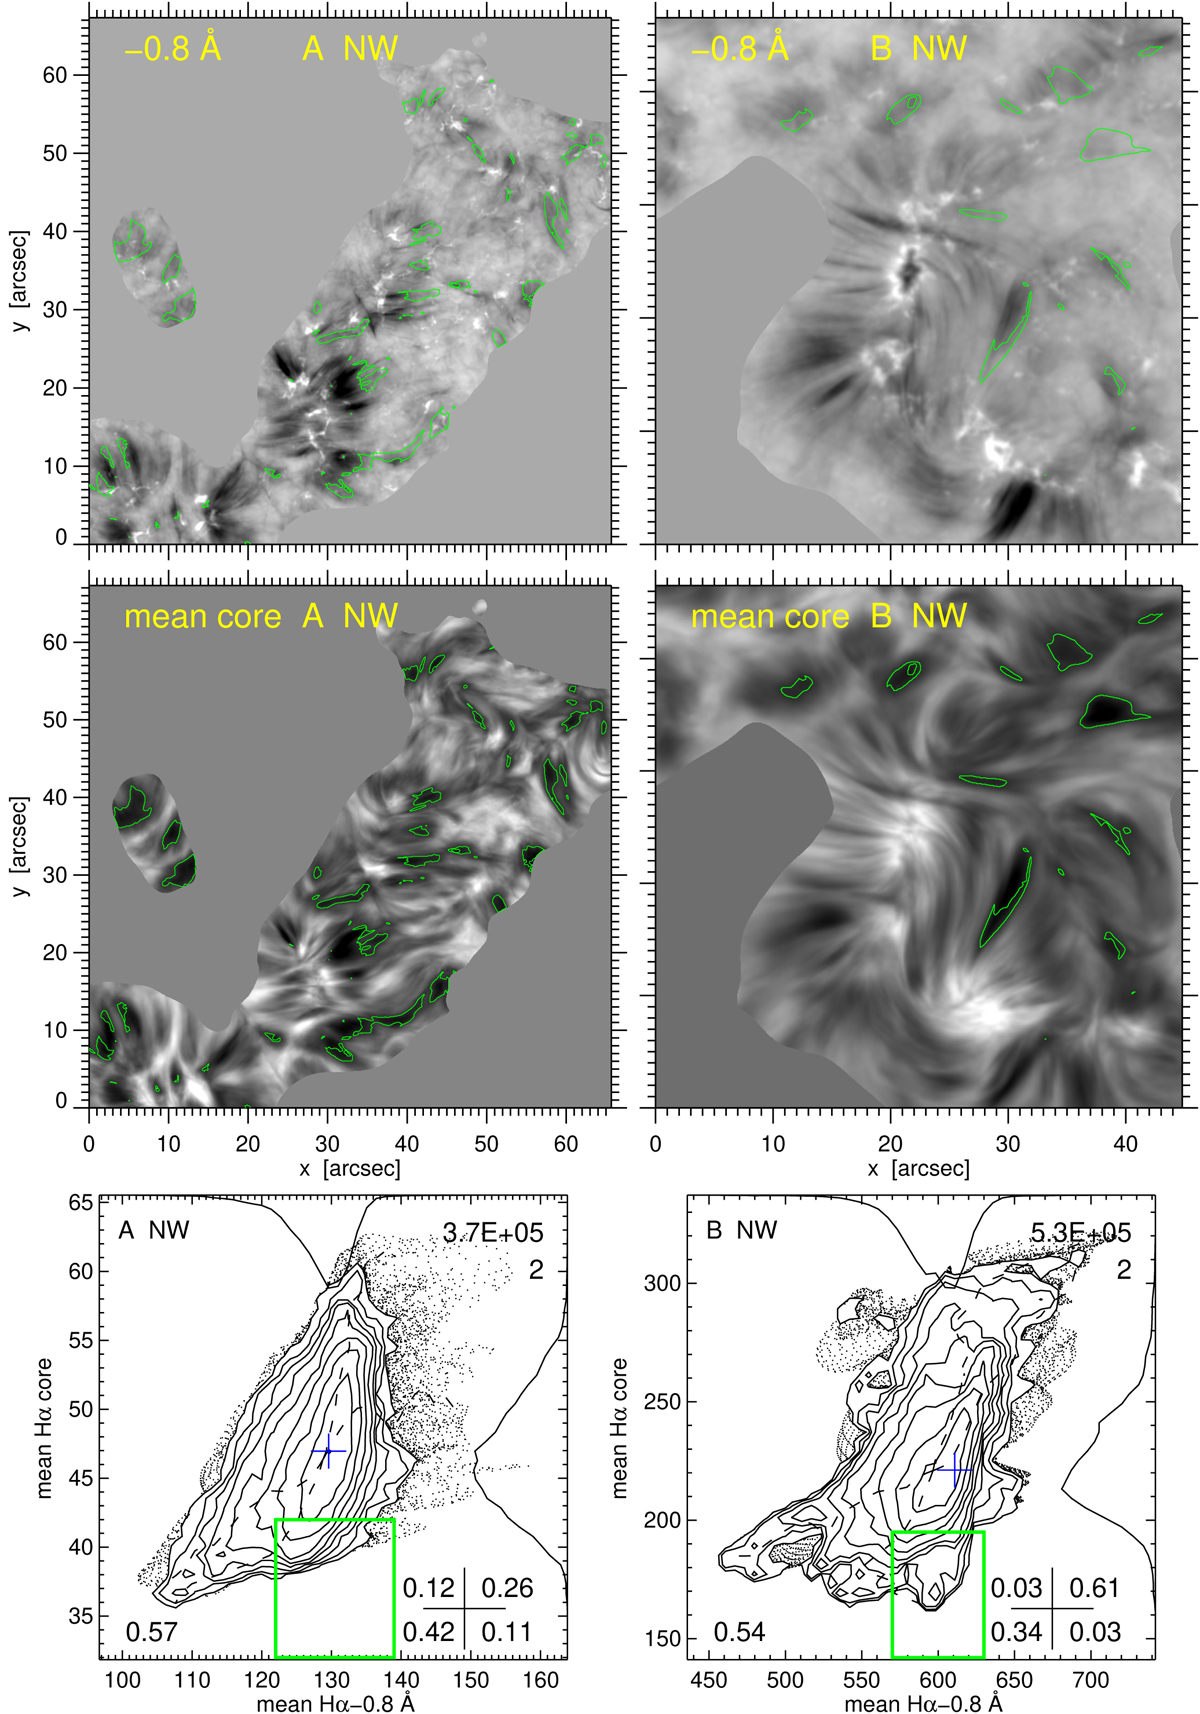
Temporal averages and scatter analysis for the network areas in data A (left) and data B (right). First row: mean images at Δλ = −0.8 Å. Second row: mean images summing the Hα core over Δλ = [ − 0.4, +0.4] Å. Third row: corresponding scatter diagrams. The poor-seeing moments are discarded, as specified in Fig. 2. The green boxes select pixels with average wing darkening but large core darkening. Online image blinkers: 1–3, 2–4.
Current usage metrics show cumulative count of Article Views (full-text article views including HTML views, PDF and ePub downloads, according to the available data) and Abstracts Views on Vision4Press platform.
Data correspond to usage on the plateform after 2015. The current usage metrics is available 48-96 hours after online publication and is updated daily on week days.
Initial download of the metrics may take a while.