Fig. 14.
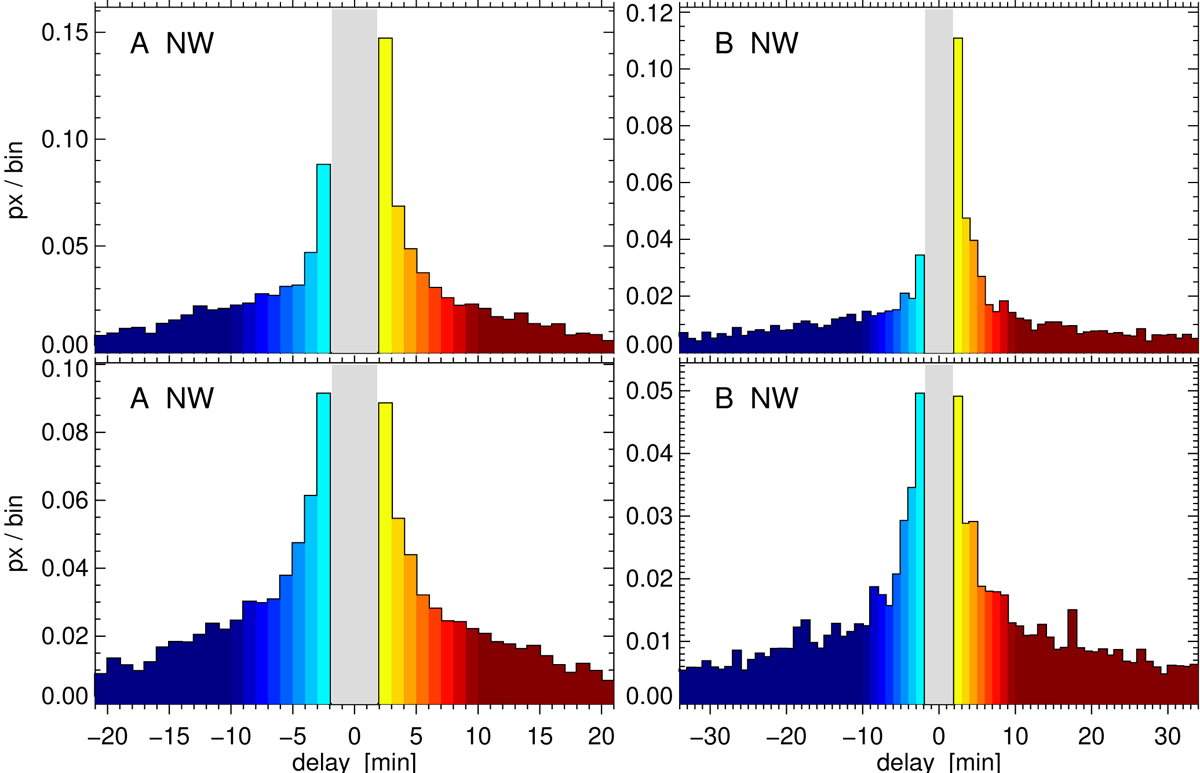
Histograms of sampling delays for data A (left) and data B (right). The latter cover a twice longer delay range than shown here. Upper row: delays corresponding to the image pairs in Fig. 12, positive for darkest line-core occurrence after darkest blue-wing occurrence per network pixel, and negative for darkest core before darkest wing occurrence. Lower row: delays between the darkest blue-wing occurrence and the second-darkest blue-wing occurrence per network pixel. The delays are color-coded as in Fig. 12. The gray rectangles mark the [−2, +2] min ranges without delay determinations. The bin widths are 1 min. The y-axes specify numbers of pixels per bin as fraction of the network area.
Current usage metrics show cumulative count of Article Views (full-text article views including HTML views, PDF and ePub downloads, according to the available data) and Abstracts Views on Vision4Press platform.
Data correspond to usage on the plateform after 2015. The current usage metrics is available 48-96 hours after online publication and is updated daily on week days.
Initial download of the metrics may take a while.