Fig. 13.
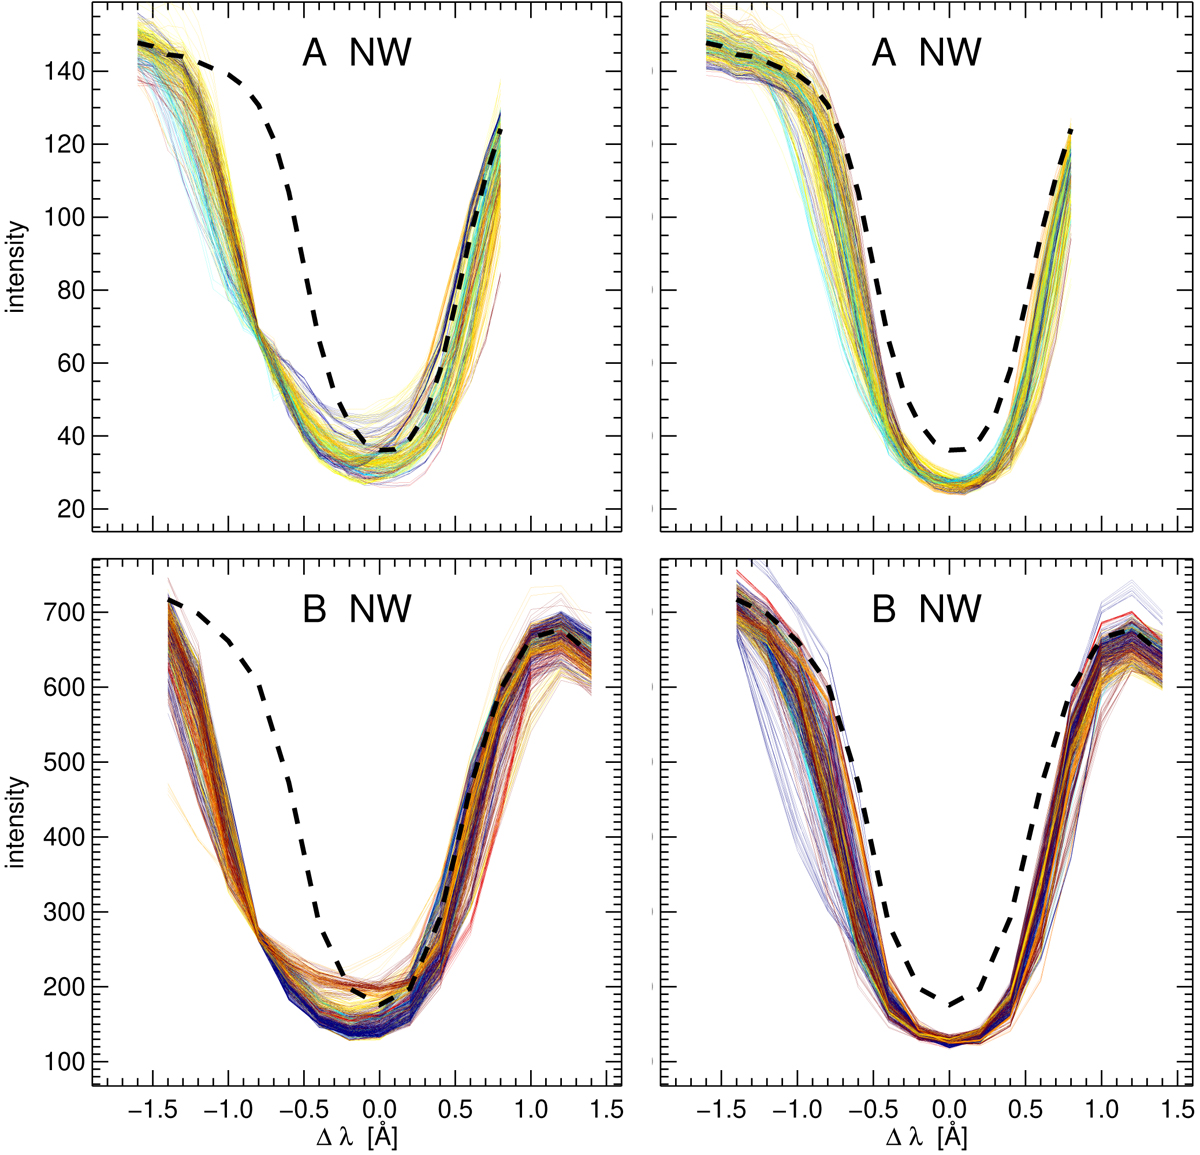
Hα profiles for all pixels selected with the small green boxes in the scatter diagrams of Fig. 12 for data A (upper row) and data B (lower row). Dashed black curve: average profile over the field of view and the sequence duration. First column: profiles at the time of each darkest blue-wing sampling. Second column: profiles at the time of each darkest core sampling. Color coding: time delay between these samples on the scale of Fig. 12. The intensity units are the same as for the scatter diagrams in Fig. 12. data A: 402 pixels with 60% within the yellow-orange 2 − 5 min positive-delay range. data B: 635 pixels with 26% within 2 − 5 min delay.
Current usage metrics show cumulative count of Article Views (full-text article views including HTML views, PDF and ePub downloads, according to the available data) and Abstracts Views on Vision4Press platform.
Data correspond to usage on the plateform after 2015. The current usage metrics is available 48-96 hours after online publication and is updated daily on week days.
Initial download of the metrics may take a while.