Fig. 12.
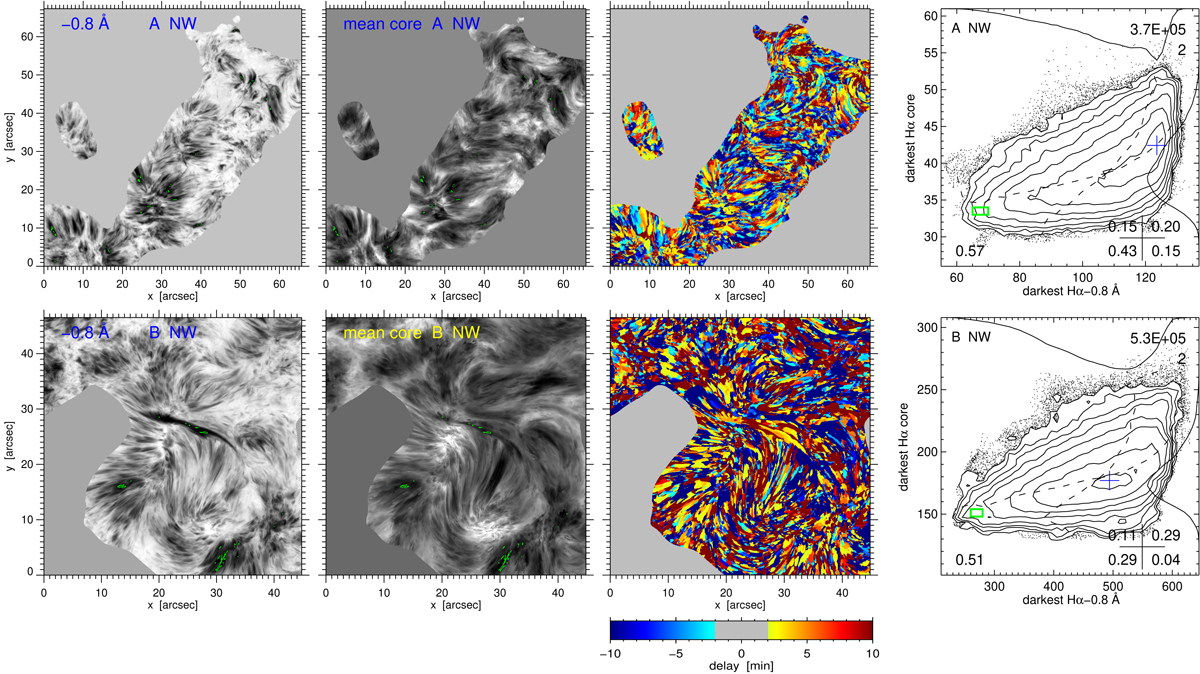
Sequence-wide dark–dark comparisons for data A (upper row) and data B (lower row) network only. First column: darkest value per network pixel during the whole sequence at Δλ = −0.8 Å. The lower image is the same as the third image in Fig. 9, except for the mask and contours. Second column: darkest value per network pixel during the whole sequence of core intensities averaged over Δλ = [ − 0.4, +0.4] Å beyond [−2, +2] min delay range around the blue-wing sampling per pixel. Third column: color-coded time delay between darkest wing occurrence and darkest core occurrence per pixel, yellow to red for increasing positive delay (core after wing) beyond 2 min, and light to dark blue for increasing negative delay (core before wing) beyond 2 min. Fourth column: scatter diagrams between the first and second images per row. The small green boxes and corresponding contours select darkest–darkest pairs of which the Hα profiles are shown in Fig. 13. Online image blinkers: 1–2, 1–3, 2–3, 4–5. 4–6, 5–6.
Current usage metrics show cumulative count of Article Views (full-text article views including HTML views, PDF and ePub downloads, according to the available data) and Abstracts Views on Vision4Press platform.
Data correspond to usage on the plateform after 2015. The current usage metrics is available 48-96 hours after online publication and is updated daily on week days.
Initial download of the metrics may take a while.